Download

1 / 19
220 likes | 416 Views
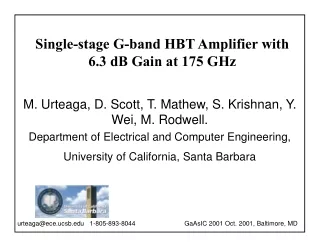
Single-stage G-band HBT Amplifier with 6.3 dB Gain at 175 GHz. M. Urteaga, D. Scott, T. Mathew, S. Krishnan, Y. Wei, M. Rodwell. Department of Electrical and Computer Engineering, University of California, Santa Barbara.

E N D
Single-stage G-band HBT Amplifier with 6.3 dB Gain at 175 GHz M. Urteaga, D. Scott, T. Mathew, S. Krishnan, Y. Wei, M. Rodwell. Department of Electrical and Computer Engineering, University of California, Santa Barbara urteaga@ece.ucsb.edu 1-805-893-8044 GaAsIC 2001 Oct. 2001, Baltimore, MD
Outline UCSB GaAs IC 2001 • Introduction • Ultra-low parasitic InP HBT technology • Circuit design • Results • Conclusion
G-band Electronics (140-220 GHz) • Applications: • Wideband communication systems • Atmospheric sensing • Automotive radar • Transistor-based ICs realized through submicrondevice scaling • State-of-the-art InP-based HEMT Amplifiers with submicron gate lengths • 3-stage amplifier with 30 dB gain at 140 GHz. • Pobanz et. al., IEEE JSSC, Vol. 34, No. 9, Sept. 1999. • 3-stage amplifier with 12-15 dB gain from 160-190 GHz • Lai et. al., 2000 IEDM, San Francisco, CA. • 6-stage amplifier with 20 6 dB from 150-215 GHz. Weinreb et. al., IEEE MGWL, Vol. 9, No. 7, Sept. 1999. • HBT is a vertical-transport device (vs. lateral-transport) Presents Challenges to Scaling
Transferred-Substrate HBTs • Substrate transfer allows simultaneous scaling of emitter and collector widths • Maximum frequency of oscillation • Submicron scaling of emitter and collector widths has resulted in record values of measured transistor power gains (U=20 dB at 110 GHz) • Promising technology for ultra-high frequency tuned circuit applications • This Work • Single-stage tuned amplifier with 6.3 dB gain at 175 GHz • Gain-per-stage amongst highest reported in this band Mesa HBT Transferred-substrate HBT
InGaAs 1E19 Si 1000 Å Grade 1E19 Si 200 Å InAlAs 1E19 Si 700 Å InAlAs 8E17 Si 500 Å Grade 8E17 Si 233 Å Grade 2E18 Be 67 Å InGaAs 4E19 Be 400 Å InGaAs 1E16 Si 400 Å InGaAs 1E18 Si 50 Å InGaAs 1E16 Si 2550 Å InAlAs UID 2500 Å S.I. InP InAlAs/InGaAs HBT Material System Layer Structure Band Diagram 2kT base bandgap grading Bias conditions for the band diagram Vbe = 0.7 V, Vce = 0.9 V
Transferred-Substrate Process Flow • Emitter metal • Emitter etch • Self-aligned base • Mesa isolation • Polyimide planarization • Interconnect metal • Silicon nitride insulation • Benzocyclobutene, etch vias • Electroplate gold • Bond to carrier wafer with solder • Remove InP substrate • Collector metal • Collector recess etch
Ultra-high fmax Submicron HBTs • Electron beam lithography used to define submicron emitter and collector stripes • Minimum feature sizes • 0.2 m emitter widths • 0.3 m collector widths • Amplifier device dimensions: • Emitter area: 0.4 x 6 m2 • Collector area: 0.7 x 6.4 m2 • Aggressive scaling of transistor dimensions predicts progressive improvement of fmax • As we scale HBT to <0.4 um, fmax keeps increasing, devicemeasurements become very difficult 0.3 m Emitter before polyimide planarization Submicron Collector Stripes(typical: 0.7 um collector)
Device Measurements RF Gains • RF Measurements: • Unilateral power gain shows peaking in DC-45 GHz band • 75-110 GHz measurements corrupted by excessive probe-to-probe coupling • Recent device measurements have shown negative unilateral power gain in W- and G- bands (2001 DRC, Notre Dame) • Second-order device physics may be important in ultra-low parasitic devices • Implications • Devices have extremely high power gains in 140-220 GHz bands, but fmax cannot be determined from 20 dB/decade extrapolation • Bias Conditions: VCE = 1.2 V, IC = 4.8 mA • Device dimensions: • Emitter area: 0.4 x 6 m2 • Collector area: 0.7 x 6.4 m2 • f = 160 GHz • DC properties: = 20,BVCEO = 1.5 V
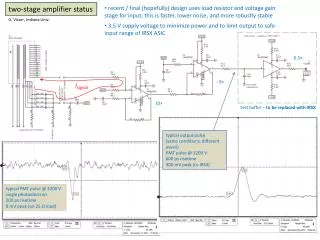
Amplifier Design • Simple common-emitter design conjugately matched at 200 GHz • Simulations predicted 6.2 dB gain • Designed using hybrid-pi model derived from DC-50 GHz measurements of previous generation devices • Electromagnetic simulator (Agilent’s Momentum) was used to characterize critical passive elements • Shunt R-C network at output provides low frequency stabilization S21 S11, S22 Schematic
Design Considerations in Sub-mmwave Bands • Transferred-substrate technology provides low inductance microstrip wiring environment • Ideal for Mixed Signal ICs • Advantages for MMIC design: • Low via inductance • Reduced fringing fields • Disadvantages for MMIC design: • Increased conductor losses • Resistive losses are inversely proportional to the substrate thickness for a given Zo • Amplifier simulations with lossless matching network showed 2 dB more gain • Possible Solutions: • Use airbridge transmission lines • Find optimum substrate thickness
140-220 GHz VNA Measurements • HP8510C VNA with Oleson Microwave Lab mmwave Extenders • GGB Industries coplanar wafer probes with WR-5 waveguide connectors • Full-two port T/R measurement capability • Line-Reflect-Line calibration with on-wafer standards • Internal bias Tee’s in probes for biasing active devices UCSB 140-220 GHz VNA Measurement Set-up
Amplifier Measurements • Measured 6.3 dB peak gain at 175 GHz • Device dimensions: • Emitter area: 0.4 x 6 m2 • Collector area: 0.7 x 6.4 m2 • Device bias conditions: • Ic= 4.8 mA, VCE = 1.2 V S21 Cell Dimensions: 690m x 350 m
Simulation vs. Measurement • Amplifier designed for 200 GHz • Peak gain measured at 175 GHz • Possible sources for discrepancy: • Matching network design • Device model
Matching Network Design Matching Network Breakout Simulation Vs. Measurement • Breakout of matching network without active device was measured on-wafer • Measurement compared to circuit simulation of passive components • Simulation shows good agreement with measurement • Verifies design approach of combining E-M simulation of critical passive elements with standard microstrip models S21 S11 S22 Red- Simulation Blue- Measurement
Device Modeling I: Hybrid-Pi Model HBT Hybrid-Pi Model Derived from DC-50 GHz Measurements • Design used a hybrid-pi device model based on DC-50 GHz measurements • Measurements of individual devices in 140-220 GHz band show poor agreement with model • Discrepancies may be due to weakness in device model and/or measurement inaccuracies • Device dimensions: • Emitter area: 0.4 x 6 m2 • Collector area: 0.7 x 6.4 m2 • Bias Conditions: • VCE = 1.2 V, IC = 4.8 mA
Device Modeling II: Model vs. Measurement • Measurements and simulations of device from 6-45 GHz and 140-220 GHz • Large discrepancies in S11 and S22 • Anomalous S12 believed to be due to excessive probe-to-probe coupling • Red- Simulation • Blue- Measurement S21 S12 S11, S22
Simulation vs. Measurement Simulation versus Measured Results Simulation Using Measured Device S-parameters • Simulated amplifier using measured device S-parameters in the 140-220 GHz band • Simulation shows good agreement with measured amplifier results • Results point to weakness in hybrid-pi model used in the design • Improved device models are necessary for better physical understanding but measured S-parameter can be used in future amplifier designs
Multi-stage Amplifier Design Simulation Results • Three-stage amplifier designed using measured transistor S-parameters • Simulated 20 dB gain at 175 GHz • Design currently being fabricated Multi-stage amplifier layout
Conclusions UCSB GaAs IC 2001 • Single-stage HBT amplifier with 6.3 dB at 175 GHz • Simple design provides direction for future high frequency MMIC work in transferred-substrate process • Observed anomalies in extending hybrid-pi model to higher frequencies Future Work • Multi-stage amplifiers and oscillators • Improved device performance for higher frequency operation Acknowledgements This work was supported by the ONR under grant N0014-99-1-0041 And the AFOSR under grant F49620-99-1-0079