Download
1 / 1
10 likes | 120 Views
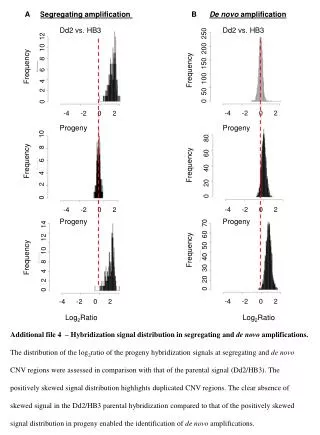
Segregating deletion. B. De novo deletion. A. Dd2 vs. HB3. Dd2 vs. HB3. 0 2 4 6 8 10. Frequency. Frequency. 0 20 40 60. -4 -2 0 2. -4 -2 0 2. Progeny. Progeny. 0 10 20 30 40 50 60.

E N D
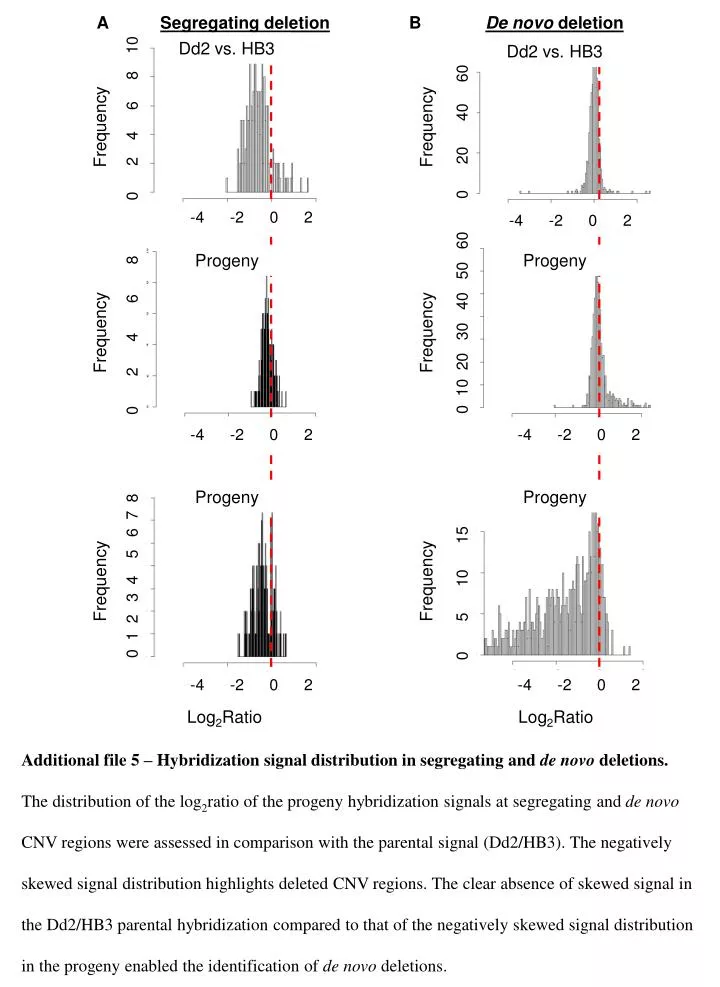
Segregating deletion B De novo deletion A Dd2 vs. HB3 Dd2 vs. HB3 0 2 4 6 8 10 Frequency Frequency 0 20 40 60 -4 -2 0 2 -4 -2 0 2 Progeny Progeny 0 10 20 30 40 50 60 0 2 4 6 8 Frequency Frequency -4 -2 0 2 -4 -2 0 2 Progeny Progeny 0 1 2 3 4 5 6 7 8 Frequency Frequency 0 5 10 15 -4 -2 0 2 -4 -2 0 2 Log2Ratio Log2Ratio Additional file 5 – Hybridization signal distribution in segregating and de novo deletions. • The distribution of the log2ratio of the progeny hybridization signals at segregating and de novo CNV regions were assessed in comparison with the parental signal (Dd2/HB3). The negatively skewed signal distribution highlights deleted CNV regions. The clear absence of skewed signal in the Dd2/HB3 parental hybridization compared to that of the negatively skewed signal distribution in the progeny enabled the identification of de novo deletions.