Download
1 / 11
120 likes | 133 Views
The technology is an automated grid control mechanism which aims to maintain the grid stability bychanging the normal pattern of electricity consumption by end users during peak hours. The virtual power plants, when integrated with demand-response mechanism using information and communication technology, effectively curtail the demand supply gap and prevent power outages.

E N D
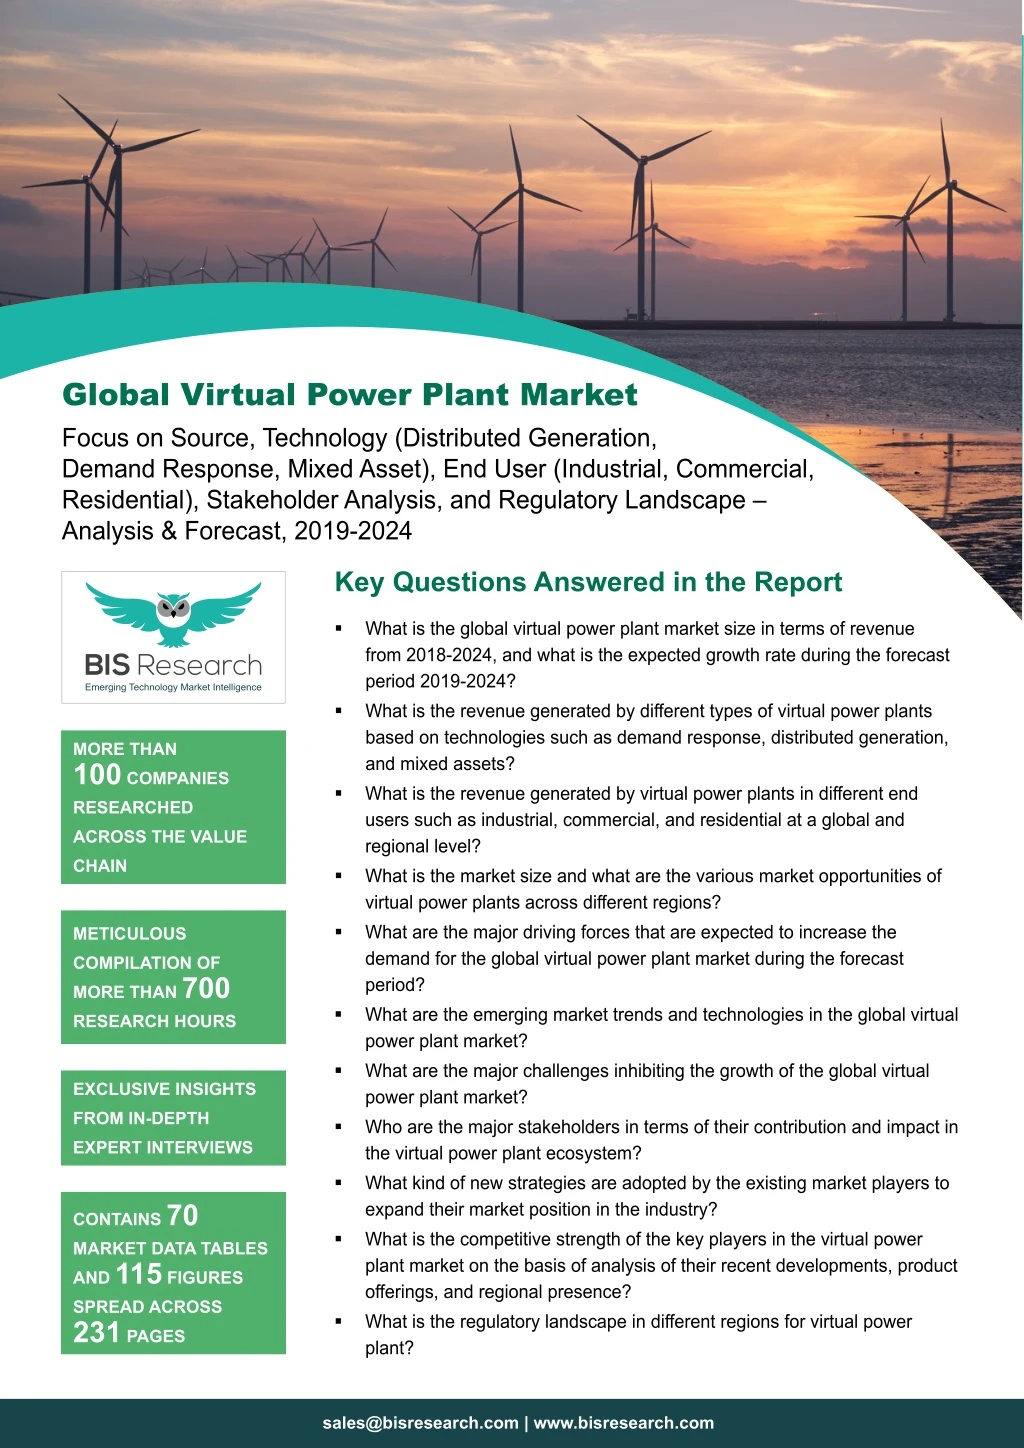
Global Virtual Power Plant Market Focus on Source, Technology (Distributed Generation, Demand Response, Mixed Asset), End User (Industrial, Commercial, Residential), Stakeholder Analysis, and Regulatory Landscape – Analysis & Forecast, 2019-2024 Key Questions Answered in the Report What is the global virtual power plant market size in terms of revenue from 2018-2024, and what is the expected growth rate during the forecast period 2019-2024? What is the revenue generated by different types of virtual power plants based on technologies such as demand response, distributed generation, and mixed assets? What is the revenue generated by virtual power plants in different end users such as industrial, commercial, and residential at a global and regional level? What is the market size and what are the various market opportunities of virtual power plants across different regions? What are the major driving forces that are expected to increase the demand for the global virtual power plant market during the forecast period? What are the emerging market trends and technologies in the global virtual power plant market? What are the major challenges inhibiting the growth of the global virtual power plant market? Who are the major stakeholders in terms of their contribution and impact in the virtual power plant ecosystem? What kind of new strategies are adopted by the existing market players to expand their market position in the industry? What is the competitive strength of the key players in the virtual power plant market on the basis of analysis of their recent developments, product offerings, and regional presence? What is the regulatory landscape in different regions for virtual power plant? MORE THAN 100 COMPANIES RESEARCHED ACROSS THE VALUE CHAIN METICULOUS COMPILATION OF MORE THAN 700 RESEARCH HOURS EXCLUSIVE INSIGHTS FROM IN-DEPTH EXPERT INTERVIEWS CONTAINS 70 MARKET DATA TABLES AND 115 FIGURES SPREAD ACROSS 231 PAGES sales@bisresearch.com | www.bisresearch.com
Table of Contents COMPANY PROFILES OVERVIEW: VIRTUAL POWER PLANT ABB Ltd Types of Virtual Power Plant Solutions Use Cases of Virtual Power Plant AutoGrid Systems, Inc Advanced Microgrid MARKET DYNAMICS Solutions, Inc. CISCO Systems Inc. Market Drivers Market Restraints Market Opportunities energy & meteo systems Enbala Power Networks Inc. Enel X North America, Inc. COMPETITIVE LANDSCAPE General Electric Key Market Developments and Strategies Competitive Positioning of Key Players in Virtual Power Plant Market Competitive Benchmarking Hitachi, Ltd. Itron Inc. Mitsubishi Electric Corporation INDUSTRY ANALYSIS Next Kraftwerke Siemens AG Role of Internet of Things in Virtual Power Plant Market Schneider Electric Stakeholder Analysis Tesla, Inc. Transmission System Operators Distribution System Operators Energy Management and Automation Companies REPORT SCOPE AND Aggregators End Users (Industrial, Commercial, and Residential) METHODOLOGY Emerging Trends in the Virtual Power Plant Market Report Scope Investment and Funding Landscape Virtual Power Plant Market Regulatory Landscape Research Methodology Consortiums and Associations VIEW COMPLETE TABLE OF CONTENT sales@bisresearch.com | www.bisresearch.com
Table of Contents GLOBAL VIRTUAL POWER PLANT MARKET (BY SOURCE) Assumptions and Limitations for Analysis and Forecast of the Global Virtual Power Plant Market Market Overview Distributed Energy Generation Units Energy Storage Systems GLOBAL VIRTUAL POWER PLANT MARKET (BY TECHNOLOGY TYPE) Market Overview Demand Response Distributed Generation Mixed Asset GLOBAL VIRTUAL POWER PLANT MARKET, (BY END USER) Market Overview Industrial Commercial Residential GLOBAL VIRTUAL POWER PLANT MARKET (BY REGION) North America Europe Asia-Pacific Rest-of-the-World (RoW) sales@bisresearch.com | www.bisresearch.com
List of Tables 1. Segregation of Virtual Power Plant by Different Types Functions of Technical Virtual Power Plants Key Players Providing Technical Virtual Power Plants Entities of Commercial Virtual Power Plants List of Investors Promoting Decentralized Energy System Levelized Cost of Electricity (LCOE) for Distributed Energy Sources Initiatives by Governments of Various Countries to Promote Virtual Power Plants Impact Analysis of Restraints Initiatives for the Advancement of the U.S. Grid Network Competitive Benchmarking of Aggregators in Virtual Power Plant Market Competitive Benchmarking of Energy Management and Automation Companies in Virtual Power Plant Market Overview of Stakeholder Analysis List of Key European Transmission System Operators by Countries Recent Developments by the Energy Management and Automation Companies in Virtual Power Plant Market Key Features of Some of the Leading Aggregators Opportunities of Big Data Analytics in Virtual Power Plants Functions of Aggregators in the Electrical Ecosystem Benefits of Demand Side Management Venture Capital Investments in Virtual Power Plant Market Key Regulatory Bodies in the U.S. Power Industry Key Regulatory Bodies in Canada Power Industry Key Regulatory Bodies in German Power Industry Key Regulatory Bodies in the Australian Power Industry Key Regulatory Bodies in the China Power Industry Examples of Some Associations, and Consortiums Global Virtual Power Plant Market (by Source), $Million 2018-2024 27. Regulatory Policies to promote Distributed Generation Applications of Energy Storage Systems in the Power Supply Network Global Virtual Power Plant Market (by Technology), $Million, 2018-2024 Features of Demand Response Mechanism for Virtual Power Plants Demand Response Programs in the U.S. Key Players Providing Demand Response Virtual Power Plants Features and Advantages of Distributed Generation Technology for Virtual Power Plant Features of Mixed Assets Technology for Virtual Power Plant Global Virtual Power Plants Market (by End User), $Million, 2018-2024 Product Portfolio of Key Industrial Virtual Power Plants consumers Global Virtual Power Plant Market (by Region), 2018-2024, $Million North America in Virtual Power Plant (by End User), 2018-2024, $Million North America in Virtual Power Plant Market (by Country), 2018-2024, $Million Demand-Response Programs in the U.S. Peak Demand Reduction in Various Demand- Response Programs Comparison of Electricity Prices during Peak and Off- Peak hours in Canada, 2018 Europe Virtual Power Plant Market, 2018-2024, $Million Europe Virtual Power Plant Market (by End User), 2018-2024, $Million Europe Virtual Power Plants Market (by Country), 2018-2024, $Million Comparison of Coal Consumption Across Various Sectors in 2016 and 2017 Energy Efficient Investments made by Italian government pertaining to Residential and Industrial consumers Virtual Power Plant Installations in Italy Virtual Power Plant Installations by Key Players 2. 3. 28. 29. 4. 5. 30. 31. 32. 6. 7. 33. 8. 9. 34. 35. 10. 36. 11. 37. 12. 13. 38. 39. 14. 40. 41. 15. 16. 42. 17. 43. 18. 19. 44. 45. 20. 21. 22. 23. 46. 47. 24. 25. 26. 48. 49. sales@bisresearch.com | www.bisresearch.com
List of Tables 50. Asia-Pacific Virtual Power Plants Market (by End User), 2018-2024, $Million Asia-Pacific Virtual Power Plants Market (by Country), 2018-2024, $Million Virtual Power Plant Installations in Japan Australia Government Initiatives for Energy Conservation Virtual Power Plant Initiatives and Advancements in South Korea RoW Virtual Power Plant Market (by End User), 2018-2024, $Million ABB Ltd.: Product Portfolio Autogrid Systems, Inc: Product Portfolio Advanced Microgrid Solutions Inc: Product Portfolio 59. Cisco Systems Inc.: Product Portfolio 60. energy & meteo systems: Product Portfolio 51. 61. Enbala Power Networks Inc.: Product Portfolio 62. Enel X North America, Inc.: Product Portfolio 52. 53. 63. General Electric: Product Portfolio 64. Hitachi Ltd.: Product Portfolio 54. 65. Itron Inc.: Product Portfolio 66. A: Product Portfolio 55. 67. Next Kraftwerke: Product Portfolio 68. Siemens AG: Product Portfolio 56. 57. 58. 69. Schneider Electric: Product Portfolio 70. Tesla Inc.: Product Portfolio sales@bisresearch.com | www.bisresearch.com
List of Figures 1. 2. Technological Transformation of the Power Industry Factors Affecting the Global Virtual Power Plant Market Global Virtual Power Plant Market Snapshot Global Virtual Power Plant Market (by Source Type), 2019-2024, ($Million) Global Virtual Power Plant Market by End User, 2019 and 2024 Regional Virtual Power Plant Market Snapshot Functions of Commercial Virtual Power Plants Energy Storage Management Model Demand-Response Management Model Distributed Energy Resource Management Model Asset Remote Control Model Market Dynamics Impact Analysis of Drivers Advantages of Using Blockchain in Virtual Power Plant Strategies Adopted by the Key Players (January 2016 – April 2019) Share of Key Market Strategies and Developments (January 2016 – April 2019) Partnerships, Collaborations, and Joint Ventures Share (by Companies) Mergers and Acquisitions Share (by Companies) Product Launches and Developments Share (by Companies) Business Expansions and Contracts Share (by Companies) Competitive Positioning of Market Players Virtual Power Plant Technologies Provided by the Virtual Power Plant Players End Users Catered by Virtual Power Plant Players IoT-Enabled Virtual Power Plant Key Stakeholders of Virtual Power Plant Market Role of Distribution System Operator due to the Deployment of Distributed Energy Resources Growth Matrix of Aggregators Application of Virtual Power Plant for Residential, Commercial, and Industrial End Users Advantages of Using Big Data Analytics for Virtual Power Plant Leading Aggregators in Different Countries Investments in Virtual Power Plant Sector Overview of a Virtual Power Plant 33. Distributed Energy Generation in Virtual Power Plants Market, 2018-2024 Energy Storage Systems in Virtual Power Plant Market, 2018-2024 Benefits of Different Technology-Based Virtual Power Plant Demand Response Technology-Based Virtual Power Plant Market, 2018-2024 Distributed Generation Technology-Based Virtual Power Plants Market, 2018-2024 Operation of Mixed Assets Technology-Based Virtual Power Plant Mixed Asset Technology-Based Virtual Power Plants Market, 2018-2024 Major End Users for Virtual Power Plants Virtual Power Plant Market for Industrial Sector, 2018-2024 Commercial Virtual Power Plant Market, 2018-2024 Overview of Residential Virtual Power Plant Residential Virtual Power Plants Market, 2018-2024 Global Virtual Power Plant Regional Market Snapshot North America Virtual Power Plant Market, 2018- 2024, $Million U.S. Electricity Generation (by Sector) in 2018 The U.S. Virtual Power Plants Market, 2018-2024, $Million Energy Mix of Canada, 2016 Canada Virtual Power Plant Market, 2018-2024, $Million The U.K. Virtual Power Plant Market, 2018-2024, $Million Germany Virtual Power Plant Market, 2018-2024, $Million Energy Mix of France, 2018 France Virtual Power Plant Market, 2018-2024, $Million Italy Virtual Power Plant Market, 2018-2024, $Million Denmark Virtual Power Plant Market, 2018-2024, $Million Rest–of-Europe in Virtual Power Plant Market, 2018-2024, $Million Asia-Pacific Virtual Power Plants Market, 2018- 2024, $Million Japan Virtual Power Plant Market, 2018-2024, $Million 34. 3. 4. 35. 36. 5. 37. 6. 7. 8. 9. 10. 11. 12. 13. 14. 38. 39. 40. 41. 42. 43. 44. 45. 15. 16. 46. 17. 47. 48. 18. 19. 49. 50. 20. 21. 22. 51. 52. 23. 24. 25. 26. 53. 54. 55. 27. 28. 56. 29. 57. 30. 31. 32. 58. 59. sales@bisresearch.com | www.bisresearch.com
List of Figures 60. Australia in Virtual Power Plant Market, 2018-2024, $Million China Virtual Power Plant Market, 2018-2024, $Million South Korea Virtual Power Plant Market, 2018- 2024, $Million Rest–of-Asia-Pacific Virtual Power Plant Market, 2018-2024, $Million RoW Virtual Power Plants Market, 2018-2024, $Million Segmentation of Key Companies Profiled ABB Ltd: Overall Financials, 2016-2018 ABB Ltd.: Net Revenue by Operating Segment, 2016-2018 ABB Ltd.: Net Revenue by Regional Segment, 2016-2018 ABB Ltd.: SWOT Analysis Autogrid Systems, Inc: SWOT Analysis Advanced Microgrid Solutions: SWOT Analysis Cisco Systems Inc.: Overall Financials, 2016-2018 Cisco Systems Inc.: Net Revenue by Business Segment, 2016-2018 Cisco Systems: Net Revenue (by Region), 2016- 2018 Research and Development: Cisco Systems – 2016 to 2018 Cisco Systems Inc.: SWOT Analysis energy & meteo systems: SWOT Analysis Enbala Power Networks Inc.: SWOT Analysis Enel X North America, Inc.: Net Revenue by Regional Segment, 2018 Enel X North America, Inc.: SWOT Analysis General Electric: Overall Financials, 2016-2018 General Electric: Net Revenue by Business Segment, 2016-2018 General Electric: Net Revenue by Regional Segment, 2016-2018 General Electric: Research and Development: 2016-2018 General Electric: SWOT Analysis Hitachi: Overall Financials, 2015-2017 Hitachi Ltd.: Net Revenue by Operating Segment 2015-2017 Hitachi ltd.: Net Revenue by Regional Segment 2015-2017 Research and Development-2015 to 2017 Hitachi Ltd.: SWOT Analysis Itron Inc: Overall Financials, 2015-2017 Itron Inc.: Net Revenue by Operating Segment, 2015-2017 Itron Inc.: Net Revenue by Regional Segment, 2015-2017 Itron: SWOT Analysis Mitsubishi Electric Corporation: Overall Financials, 2016-2018 Mitsubishi Electric Corporation.: Net Revenue by Operating Segment, 2016-2018 Mitsubishi Electric Corporation.: Net Revenue by Regional Segment, 2016-2018 Mitsubishi Electric Corporation: SWOT Analysis Next Kraftwerke: SWOT Analysis 100. Siemens AG: Overall Financials, 2016-2018 101. Siemens AG: SWOT Analysis 102. Schneider Electric: Overall Financials, 2016-2018 103. Schneider Electric: Net Revenue by Business Segment, 2016-2018 104. Schneider Electric: Net Revenue by Regional Segment, 2016-2018 105. Research and Development: Schneider Electric – 2016 to 2018 106. Schneider Electric: SWOT Analysis 107. Tesla Inc.: Overall Financials, 2016-2018 108. Tesla Inc.: Net Revenue by Operating Segment, 2016-2018 109. Tesla Inc.: SWOT Analysis 110. Virtual Power Plant Market Scope 111. Report Methodology 112. Primary Interviews Breakdown, by Company, Designation and Region 113. Sources of Secondary Research 114. Data Triangulation 115. Top Down-Bottom-Up Approach for Market Estimation 88. 61. 89. 90. 91. 92. 62. 63. 64. 93. 65. 66. 67. 94. 95. 96. 68. 97. 69. 70. 71. 72. 73. 98. 99. 74. 75. 76. 77. 78. 79. 80. 81. 82. 83. 84. 85. 86. 87. sales@bisresearch.com | www.bisresearch.com
Research Scope & BIS Methodology 1. Scope of the Report The report is a thorough study of the virtual power plant market share and market size, including the analysis of different sources, technologies, and end users of virtual power plant industry. The market trends across the regions have also been extensively analyzed in the virtual power plant market study. Further, the market estimated in different sections of the report considered “2019-2024” as the forecast period. 2. Virtual Power Plant Market Research Methodology The research methodology design adopted for this specific study includes a mix of data collected from primary and secondary sources. The research exhaustively use both primary sources (in-house experts, industry leaders and market players) and secondary sources (a host of paid and unpaid databases) along with analytical tools to build forecast and predictive models. Primary Data Sources The primary sources involve the industry experts from the virtual power plant market. In the extensive primary research process undertaken for this study, the primary sources include industry experts and key executives from prominent companies, research organizations and energy management associations. All such resources have been interviewed to obtain and verify both the qualitative and the quantitative aspects of this research study. The Key Data Points Taken From Primary Sources Include: Validation and triangulation of all the numbers and graphs Validation of report’s segment and key qualitative findings Understanding the competitive landscape Validation of several markets for the fermented feed type Percentage split for countries The research includes interviews with participants throughout the value chain. An extensive questionnaire was shared to get insights from the experts who didn’t participate in discussions. In some cases where information was not available, Delphi method was used to arrive at mutual consent with BIS consultants. sales@bisresearch.com | www.bisresearch.com
Research Scope & BIS Methodology Figure 1: Research Methodology Scope Definition Research Design Market Study Qualitative Quantitative Primary Interviews/ Secondary Research Top-Down and Bottom-Up Primary & Secondary Data Report Writing Data Validation Data Analysis Data Collection Secondary Data Sources The research study involves the usage of extensive secondary sources such as databases, company websites, and annual reports, among others. It also makes use of databases such as Hoovers, Bloomberg, Business-week, and Factiva to collect useful information for an extensive, market-oriented, and commercial study of the global market. Secondary research was done in order to obtain crucial information about the industry’s value chain, market’s monetary chain, total pool of key players, and the prevalent solutions and application segments. The following figure exhibits key secondary data sources considered: sales@bisresearch.com | www.bisresearch.com
Research Scope & BIS Methodology Figure 2: Data Triangulation The process of market engineering involves calculation of the market statistics, market size estimation, market forecast, market crackdown, and data triangulation (the methodology for these quantitative data processes is explained in the further sections). An extensive primary research study was undertaken to gather information, and authenticate the critical numbers arrived through segmentation types, industry trends, and key players of each type of solutions in the market. BIS Research Internal Repository Key Players Competitive Landscape Opportunities/Challenges Market Size and Market Share (2018-2024) Macro-Economic Factors Market Estimates Regional Analysis Bis Research Internal Repository DATA TRIANGULATION Primary Sources Secondary Sources Primary Sources Secondary Sources Interviews With: SEC Filings Investor Presentations Journals Press Releases Paid & Unpaid Databases IRENA United States Department of Energy Reports Research Articles Energy Management and Automation Companies VPP Aggregators Utilities Research Organizations REQUEST FOR SAMPLE sales@bisresearch.com | www.bisresearch.com
BIS Research 39111 Paseo Padre PKWY STE 313, Fremont CA 94538-1686, Tel: +1-510-404-8135 Global Delivery Centre Tapasya Corp Heights, Subarea, Sector 126, Noida, NCR-201303 India Tel: +91 120 4261540 / +91 120 4261544 To know more about us, please visit our website: bisresearch.com For other queries contact: sales@bisresearch.com sales@bisresearch.com | www.bisresearch.com sales@bisresearch.com | www.bisresearch.com