Download
1 / 10
100 likes | 111 Views
The HEVs cannot be charged through a plugin source or a charging station. The electric motor derives electrical energy from a generator that is powered by the ICE. In case of long range drives, power is derived from the ICE, and when less power is required, the excess energy from the ICE gets stored in the batteries.

E N D
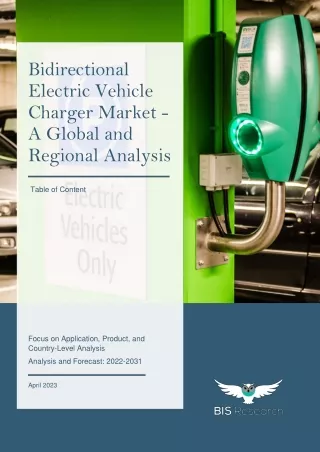
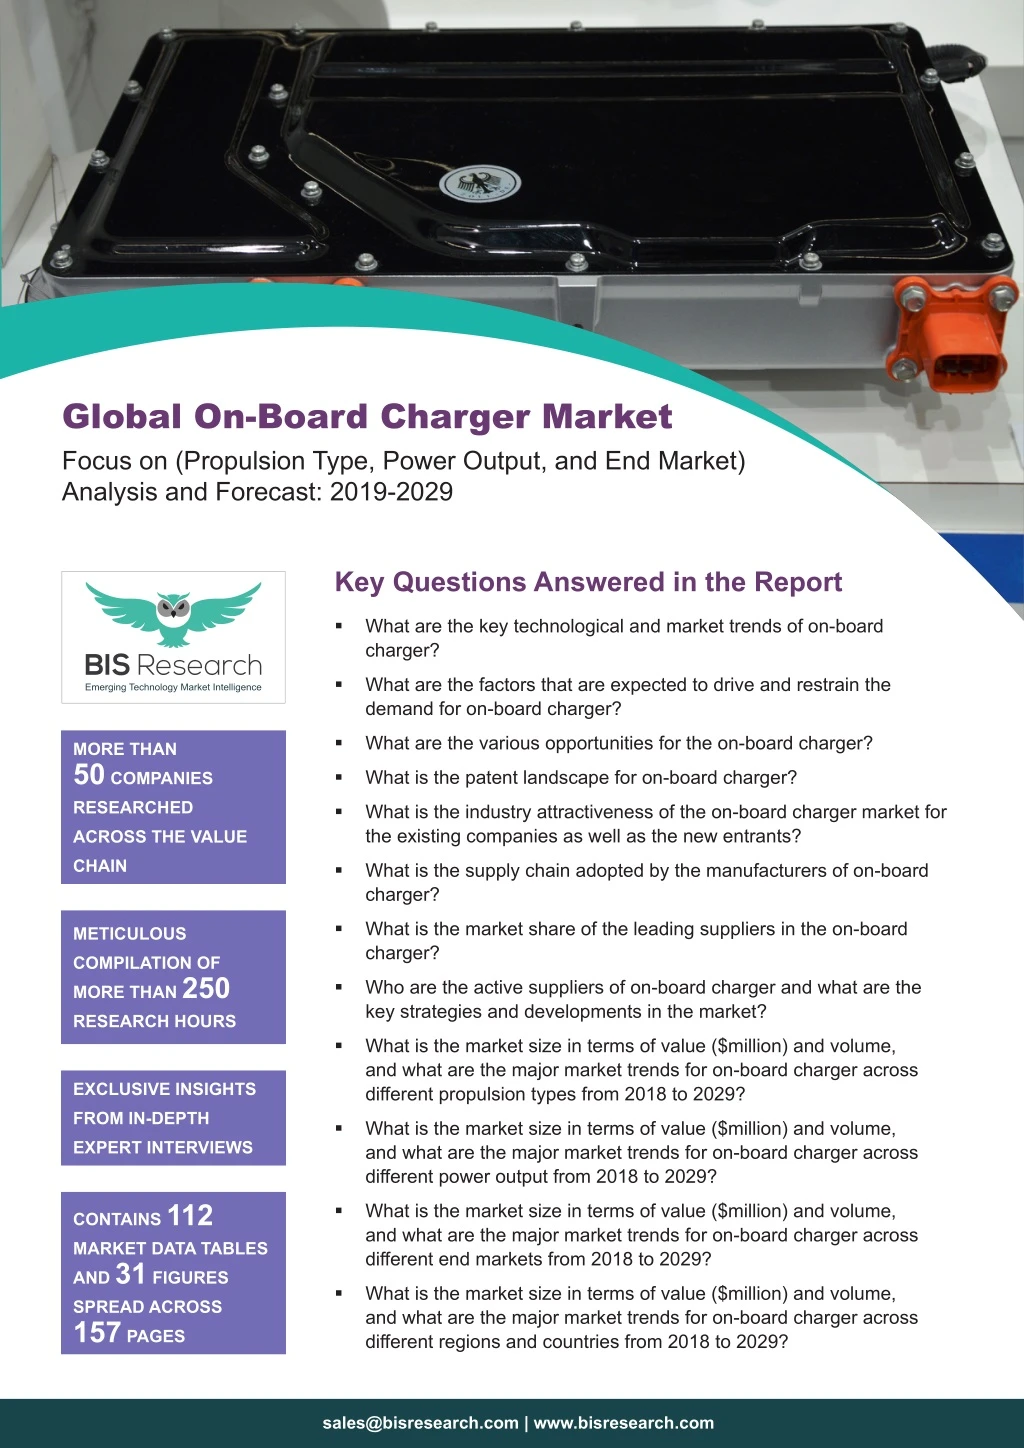
Global On-Board Charger Market Focus on (Propulsion Type, Power Output, and End Market) Analysis and Forecast: 2019-2029 Key Questions Answered in the Report What are the key technological and market trends of on-board charger? What are the factors that are expected to drive and restrain the demand for on-board charger? What are the various opportunities for the on-board charger? MORE THAN 50 COMPANIES RESEARCHED What is the patent landscape for on-board charger? What is the industry attractiveness of the on-board charger market for the existing companies as well as the new entrants? ACROSS THE VALUE CHAIN What is the supply chain adopted by the manufacturers of on-board charger? What is the market share of the leading suppliers in the on-board charger? METICULOUS COMPILATION OF MORE THAN 250 RESEARCH HOURS Who are the active suppliers of on-board charger and what are the key strategies and developments in the market? What is the market size in terms of value ($million) and volume, and what are the major market trends for on-board charger across different propulsion types from 2018 to 2029? EXCLUSIVE INSIGHTS FROM IN-DEPTH What is the market size in terms of value ($million) and volume, and what are the major market trends for on-board charger across different power output from 2018 to 2029? EXPERT INTERVIEWS CONTAINS 112 MARKET DATA TABLES AND 31 FIGURES SPREAD ACROSS 157 PAGES What is the market size in terms of value ($million) and volume, and what are the major market trends for on-board charger across different end markets from 2018 to 2029? What is the market size in terms of value ($million) and volume, and what are the major market trends for on-board charger across different regions and countries from 2018 to 2029? sales@bisresearch.com | www.bisresearch.com
Table of Contents SCOPE & RESEARCH METHODOLOGY Technological Trends Market Trends Patent Analysis Electric Vehicle Charging System Electric Vehicle Policies, Consortiums, and Associations Drivers Restraints Opportunities Challenges Industry Attractiveness Supply Chain Analysis Scope of the Report INDUSTRY ANALYSIS OF ON-BOARD CHARGER MARKET Global On-Board Charger Market Research Methodology COMPETITIVE LANDSCAPE OF ON-BOARD CHARGER SUPPLIERS GLOBAL ON-BOARD CHARGER MARKET, (BY PROPULSION TYPE), ANALYSIS AND FORECAST: 2018-2029 ($MILLION) AND (THOUSAND UNITS) Key Market Developments and Strategies Who Supply Whom? Competitive benchmarking of Key Manufacturers GLOBAL ON-BOARD CHARGER MARKET, (BY POWER OUTPUT), ANALYSIS AND FORECAST: 2018-2029 ($MILLION) AND (THOUSAND UNITS) Assumptions and Limitations Market Overview Battery Electric Vehicles (BEV) Plug-in Hybrid Electric Vehicles (PHEV) Market Overview 0-7.2 kW Above 7.2 kW GLOBAL ON-BOARD CHARGER MARKET, (BY END MARKET), ANALYSIS AND FORECAST: 2019-2029 ($MILLION) AND (THOUSAND UNITS) Market Overview Original Equipment Manufacturers (OEM) Aftermarket GLOBAL ON-BOARD CHARGER MARKET, (BY REGION), ANALYSIS AND FORECAST: 2018-2029 ($MILLION) AND (THOUSAND UNITS) Market Overview North America Europe Asia-Pacific (APAC) Rest-of-the-World (RoW) VIEW COMPLETE TABLE OF CONTENT sales@bisresearch.com | www.bisresearch.com
List of Tables 1. Consortiums and Associations 30. 3.3 kW On-Board Charger Specifications 2. List of Government Initiatives 31. Global On-Board Charger Market (by End Market), Thousand Units, 2018-2029 3. Material and Components Pricing Scenario for DC Fast Charging System 32. Global On-Board Charger Market (by End Market), $Million, 2018-2029 4. Impact of Market Drivers 33. Global On-Board Charger Market (by Region), Thousand Units, 2018-2029 5. Government Investment, $Million (by Country) 6. AC Charging Vs. DC Charging 34. Global On-Board Charger Market (by Region), $Million, 2018-2029 7. Power Output Comparison between AC and DC charging 35. Asia-Pacific On-Board Charger Market Size (by Propulsion Type), Thousand Units, 2018-2029 8. Impact of Market Restraints 9. Impact of Market Opportunities 36. Asia-Pacific On-Board Charger Market Size (by Propulsion Type), $Million, 2018-2029 10. General Charging Standards 11. Impact of Market Challenges 37. Asia-Pacific On-Board Charger Market Size (by Power Output), Thousand Units, 2018-2029 12. Analyzing the Threat of New Entrants 38. Asia-Pacific On-Board Charger Market Size (by Power output), $Million, 2018-2029 13. Analyzing the Bargaining Power of Supplier 14. Analyzing the Bargaining Power of Buyer 39. Asia-Pacific On-Board Charger Market Size (by Country), Thousand Units, 2018-2029 15. Analyzing the Threat of Substitutes 16. Analyzing the Intensity of Competition 40. Asia-Pacific On-Board Charger Market Size (by Country), $Million, 2018-2029 17. Key Business Expansion Activities 18. Key Partnerships and Collaborations 41. China On-Board Charger Market (by Propulsion Type), Thousand Units, 2018-2029 19. Key Product Launches 20. Key Other Activities 42. China On-Board Charger Market (by Propulsion Type), $Million, 2018-2029 21. Mapping of On-Board Charger Manufacture and OEM 43. China On-Board Charger Market (by Power Output), Thousand Units, 2018-2029 22. Different Propulsion Systems and Characteristic Features 44. China On-Board Charger Market (by Power output), $Million, 2018-2029 23. Global On-Board Charger Market (by Propulsion Type), Thousand Units, 2018-2029 45. Japan On-Board Charger Market (by Propulsion Type), Thousand Units, 2018-2029 24. Global On-Board Charger Market (by Propulsion Type), $Million, 2018-2029 46. Japan On-Board Charger Market (by Propulsion Type), $Million, 2018-2029 25. Types of Electric Vehicle: Advantages and Disadvantages 47. Japan On-Board Charger Market (by Power Output), Thousand Units, 2018-2029 26. Major PHEV OEMs and their Products 48. Japan On-Board Charger Market (by Power Output), $Million, 2018-2029 27. EVSE Charging Type 28. Global On-Board Charger Market (by Power Output), Thousand Units, 2018-2029 49. India On-Board Charger Market (by Propulsion Type), Thousand Units, 2018-2029 29. Global On-Board Charger Market (by Power Output), $Million, 2018-2029 sales@bisresearch.com | www.bisresearch.com
List of Tables 50. India On-Board Charger Market (by Propulsion Type), $Million, 2018-2029 71. Sweden On-Board Charger Market (by Propulsion Type), Thousand Units, 2018-2029 51. India On-Board Charger Market (by Power Output), Thousand Units, 2018-2029 72. Sweden On-Board Charger Market (by Propulsion Type), $Million, 2018-2029 52. India On-Board Charger Market (by Power output), $Million, 2018-2029 73. Sweden On-Board Charger Market (by Power Output), Thousand Units, 2018-2029 53. South Korea On-Board Charger Market (by Propulsion Type), Thousand Units, 2018-2029 74. Sweden On-Board Charger Market (by Power Output), $Million, 2018-2029 54. South Korea On-Board Charger Market (by Propulsion Type), $Million, 2018-2029 75. U.K. On-Board Charger Market (by Propulsion Type), Thousand Units, 2018-2029 55. South Korea On-Board Charger Market (by Power Output), Thousand Units, 2018-2029 76. U.K. On-Board Charger Market (by Propulsion Type), $Million, 2018-2029 56. South Korea On-Board Charger Market (by Power Output), $Million, 2018-2029 77. U.K. On-Board Charger Market (by Power Output), Thousand Units, 2018-2029 57. Rest-of-APAC On-Board Charger Market (by Propulsion Type), Thousand Units, 2018-2029 78. U.K. On-Board Charger Market (by Power Output), $Million, 2018-2029 58. Rest-of-APAC On-Board Charger Market (by Propulsion Type), $Million, 2018-2029 79. France On-Board Charger Market (by Propulsion Type), Thousand Units, 2018-2029 59. Rest-of-APAC On-Board Charger Market (by Power Output), Thousand Units, 2018-2029 80. France On-Board Charger Market (by Propulsion Type), $Million, 2018-2029 60. Rest-of-APAC On-Board Charger Market (by Power Output), $Million, 2018-2029 81. France On-Board Charger Market (by Power output), Thousand Units, 2018-2029 61. Europe On-Board Charger Market Size (by Propulsion Type), Thousand Units, 2018-2029 82. France On-Board Charger Market (by Power Output), $Million, 2018-2029 62. Europe On-Board Charger Market Size (by Propulsion Type), $Million, 2018-2029 83. Austria On-Board Charger Market (by Propulsion Type), Thousand Units, 2018-2029 63. Europe On-Board Charger Market Size (by Power Output), Thousand Units, 2018-2029 84. Austria On-Board Charger Market (by Propulsion Type), $Million, 2018-2029 64. Europe On-Board Charger Market Size (by Power Output), $Million, 2018-2029 85. Austria On-Board Charger Market (by Power Output), Thousand Units, 2018-2029 65. Europe On-Board Charger Market Size (by Country), Thousand Units, 2018-2029 86. Austria On-Board Charger Market (by Power Output), $Million, 2018-2029 66. Europe On-Board Charger Market Size (by Country), $Million, 2018-2029 87. Rest-of-Europe On-Board Charger Market (by Propulsion Type), Thousand Units, 2018-2029 67. Germany On-Board Charger Market (by Propulsion Type), Thousand Units, 2018-2029 88. Rest-of-Europe On-Board Charger Market (by Propulsion Type), $Million, 2018-2029 68. Germany On-Board Charger Market (by Propulsion Type), $Million, 2018-2029 89. Rest-of-Europe On-Board Charger Market (by Power Output), Thousand Units, 2018-2029 69. Germany On-Board Charger Market (by Power Output), Thousand Units, 2018-2029 90. Rest-of-Europe On-board Charger Market (by Power output), $Million, 2018-2029 70. Germany On-Board Charger Market (by Power Output), $Million, 2018-2029 91. North America On-Board Charger Market Size (by Propulsion Type), Thousand Units, 2018-2029 sales@bisresearch.com | www.bisresearch.com
List of Tables 92. North America On-Board Charger Market Size (by Propulsion Type), $Million, 2018-2029 103. Canada On-Board Charger Market (by Power Output), Thousand Units, 2018-2029 93. North America On-Board Charger Market Size (by Power Output), Thousand Units, 2018-2029 104. Canada On-Board Charger Market (by Power Output), $Million, |2018-2029 94. North America On-Board Charger Market Size (by Power Output), $Million, 2018-2029 105. Mexico On-Board Charger Market (by Propulsion Type), Thousand Units, 2018-2029 95. North America On-Board Charger Market Size (by Country), Thousand Units, 2018-2029 106. Mexico On-Board Charger Market (by Propulsion Type), $Million, 2018-2029 96. North America On-Board Charger Market Size (by Country), $Million, 2018-2029 107. Mexico On-Board Charger Market (by Power output), Thousand Units, 2018-2029 97. The U.S. On-Board Charger Market (by Propulsion Type), Thousand Units, 2018-2029 108. Mexico On-Board Charger Market (by Power output), $Million, 2018-2029 98. The U.S. On-Board Charger Market (by Propulsion Type), $Million, 2018-2029 109. Rest-of-the-World On-Board Charger Market Size (by Propulsion Type), Thousand Units, 2018-2029 99. The U.S. On-Board Charger Market (by Power Output), Thousand Units, 2018-2029 110. Rest-of-the-World On-Board Charger Market Size (by Propulsion Type), $Million, 2018-2029 100. The U.S. On-Board Charger Market (by Power Output), $Million, 2018-2029 111. Rest-of-the-World On-Board Charger Market Size (by Power Output), Thousand Units, 2018-2029 101. Canada On-Board Charger Market (by Propulsion Type), Thousand Units, 2018-2029 112. Rest-of-the-World On-Board Charger Market Size (by Power Output), $Million, 2018-2029 102. Canada On-Board Charger Market (by Propulsion Type), $Million, 2018-2029 sales@bisresearch.com | www.bisresearch.com
List of Figures 1. Global On-Board Charger Market Size (by Propulsion Type), Thousand Units, 2018 and 2029 Thousand Units and $Million, 2018 and 2029 17. Sales Channel for Global On-Board Charger Market 2. Global On-Board Charger Market Size (by Power Output), Thousand Units, 2018 and 2029 18. Global On-board Charger Market (by End Market), Thousand Units and $Million, 2018 and 2029 3. Global On-board Charger Market Size (by End Market), Thousand Units, 2018 and 2029 19. Global On-Board Charger Market (by Original Equipment Manufacturer), Thousand Units and $Million, 2018 and 2029 4. Global On-Board Charger Market Size (by Region), $Million, 2018-2029 20. Global On-Board Charger Market (by Aftermarket), Thousand Units and $Million, 2018 and 2029 5. Types of Non-Isolated DC-DC Converters 6. Year-Wise Patents Filed for On-Board Charger Market (by Material Type), 2016-2018 21. Global On-Board Charger Market, Regional Segmentation 7. Number of Highway Charging Stations by 2020 22. Global On-Board Charger Market (by Region), Thousand Units and $Million, 2018 and 2029 8. Porter’s Five Forces Analysis of On-Board Charger Market 23. Asia-Pacific On-Board Charger Market Size (by Propulsion Type), $Million, 2019 and 2029 9. Global On-Board Charger Supply Chain 24. Europe On-Board Charger Market Size (by Propulsion Type), $Million, 2019 and 2029 10. Key Strategies Adopted by Major Players 11. Competitive Benchmarking for Top Five Players 25. North America On-Board Charger Market Size (by Propulsion Type), $Million, 2019 and 2029 12. Classification of EVs Under Different Source of Propulsion 26. Rest-of-the-World On-Board Charger Market Size (by Propulsion Type), $Million, 2019 and 2029 13. Global On-Board Charger Market (by Propulsion Type), Thousand Units and $Million, 2018 and 2029 27. Global On-Board Charger Market Coverage 14. Global BEV On-Board Charger Market, Thousand Units and $Million, 2018-2029 28. Report Design 29. Data Triangulation 15. Global PHEV On-Board Charger Market, Thousand Units and $Million, 2018-2029 30. Top-Down and Bottom-Up Approach 16. Global On-Board Charger Market (by Power Output), 31. Data Triangulation sales@bisresearch.com | www.bisresearch.com
Research Scope & BIS Methodology 1. Scope of the Report The report constitutes an extensive study of the on-board charger market. It includes a thorough analysis of different components falling in the ecosystem, and different propulsion types using the on-board charger modules along with the various power output ranges. The on-board charger market has been further segmented in terms of end market in order to understand the behavior of different sales channels using on-board charger modules. The report further explains the driving forces, challenges, and growth opportunities of the on-board charger market. The major players in the on-board charger industry have been identified on the basis of revenue generation pertaining to the extensivity of on-board charger product offerings, R&D initiatives, geographical presence, and strategic developments related to on-board charger. A competitive landscape has been done in order to understand the players’ strategic behavior. The on-board charger market has been further explained and analyzed on the basis of geography. The geographical analysis has been done for four regions, namely North America, Europe, Asia-Pacific, and Rest- of-the-World. Moreover, the country analysis has also been done in order to obtain a clear picture of the on-board charger market. The increasing adoption of electric vehicles, and the ongoing developments in numerous regions by the governments as well as the private entities are some of the major factors based on which the countries’ growth rate has been calculated. 2. Global On-board Charger Market Research Methodology The research methodology design adopted for this specific study includes a mix of data collected from the primary and secondary sources. Both the primary sources (in-house experts, industry leaders, and market players) and the secondary sources (a host of paid and unpaid databases), along with the analytical tools have been employed to build the forecast and predictive models. Figure 1: Research Methodology Scope Definition Research Design Market Study Qualitative Quantitative Primary Interviews/ Secondary Research Top Down and Bottom Up Primary & Secondary Data Data Validation Data Analysis Data Collection Report Writing sales@bisresearch.com | www.bisresearch.com
Research Scope & BIS Methodology Primary Data Sources The primary sources involve the industry experts from the on-board charger industry, including the module providers, technology providers, solution providers, and distributors, among others. The resources such as CEOs, vice presidents, marketing directors, and technology and innovation directors, among others, have been interviewed to obtain and verify both the qualitative and quantitative aspects of this research study. The key data points taken from the primary sources include: Validation and triangulation of all the numbers and graphs Validation of report’s segmentation and key qualitative findings Understanding the competitive landscape Current and proposed production values of a particular product by market players Validation of the numbers of various markets for different modalities Percentage split of individual markets for regional analysis Emerging trends and R&D investments across regions Secondary Data Sources The research study involves the extensive usage of the secondary sources such as databases, company websites, and annual reports. The key data points taken from the secondary sources include: Segmentation breakups, split-ups, and percentage shares Data for market value Key industry trends of the top players of the market Qualitative insights into various aspects of the market, key trends, and emerging areas of innovation sales@bisresearch.com | www.bisresearch.com
Research Scope & BIS Methodology Figure 2: Data Triangulation List of Tables The following figure exhibits data triangulation considered: BIS Research Internal Repository Key Players Competitive Landscape Opportunities/Restraints Market Size and Market Share (2018) Influencing Factors Market Estimates Regional Analysis Bis Research Internal Repository DATA TRIANGULATION Primary Sources Secondary Sources Primary Sources Secondary Sources Demand Side Annual Reports of Key Industry Players SEC Filings Investor Presentations Journals Press Releases Paid and Unpaid Databases International Energy Agency (IEA) European Standards Organization (ESO) Interview With: End Users Automotive Supply Side Interview With: Senior Managers of Major Companies in the OBC Module Business Tier II Players Distributors Retailers OEMsRetailers OEMs REQUEST FOR SAMPLE sales@bisresearch.com | www.bisresearch.com
BIS Research 39111 Paseo Padre PKWY STE 313, Fremont CA 94538-1686, Tel: +1-510-404-8135 Global Delivery Centre Tapasya Corp Heights, Subarea, Sector 126, Noida, NCR-201303 India Tel: +91 120 4261540 / +91 120 4261544 To know more about us, please visit our website: bisresearch.com For other queries contact: sales@bisresearch.com sales@bisresearch.com | www.bisresearch.com sales@bisresearch.com | www.bisresearch.com