Download
1 / 10
100 likes | 103 Views
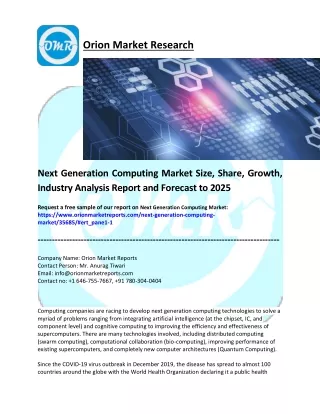
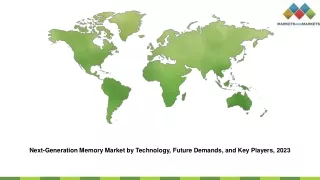
Over the last decade, significant revolutions have been witnessed in the display industry. From the introduction of cathode ray tubes to several up-gradations in the display technology, the display industry is always on the lookout for better options. Thin film transistor liquid crystal displays (TFT LCDs) and organic light emitting diodes (OLEDs) are currently among the most widely used technologies for the display industry, owing to their enhanced display quality and the consumer preference for them.

E N D
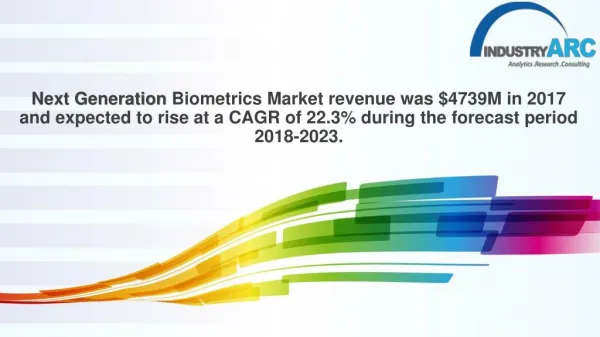
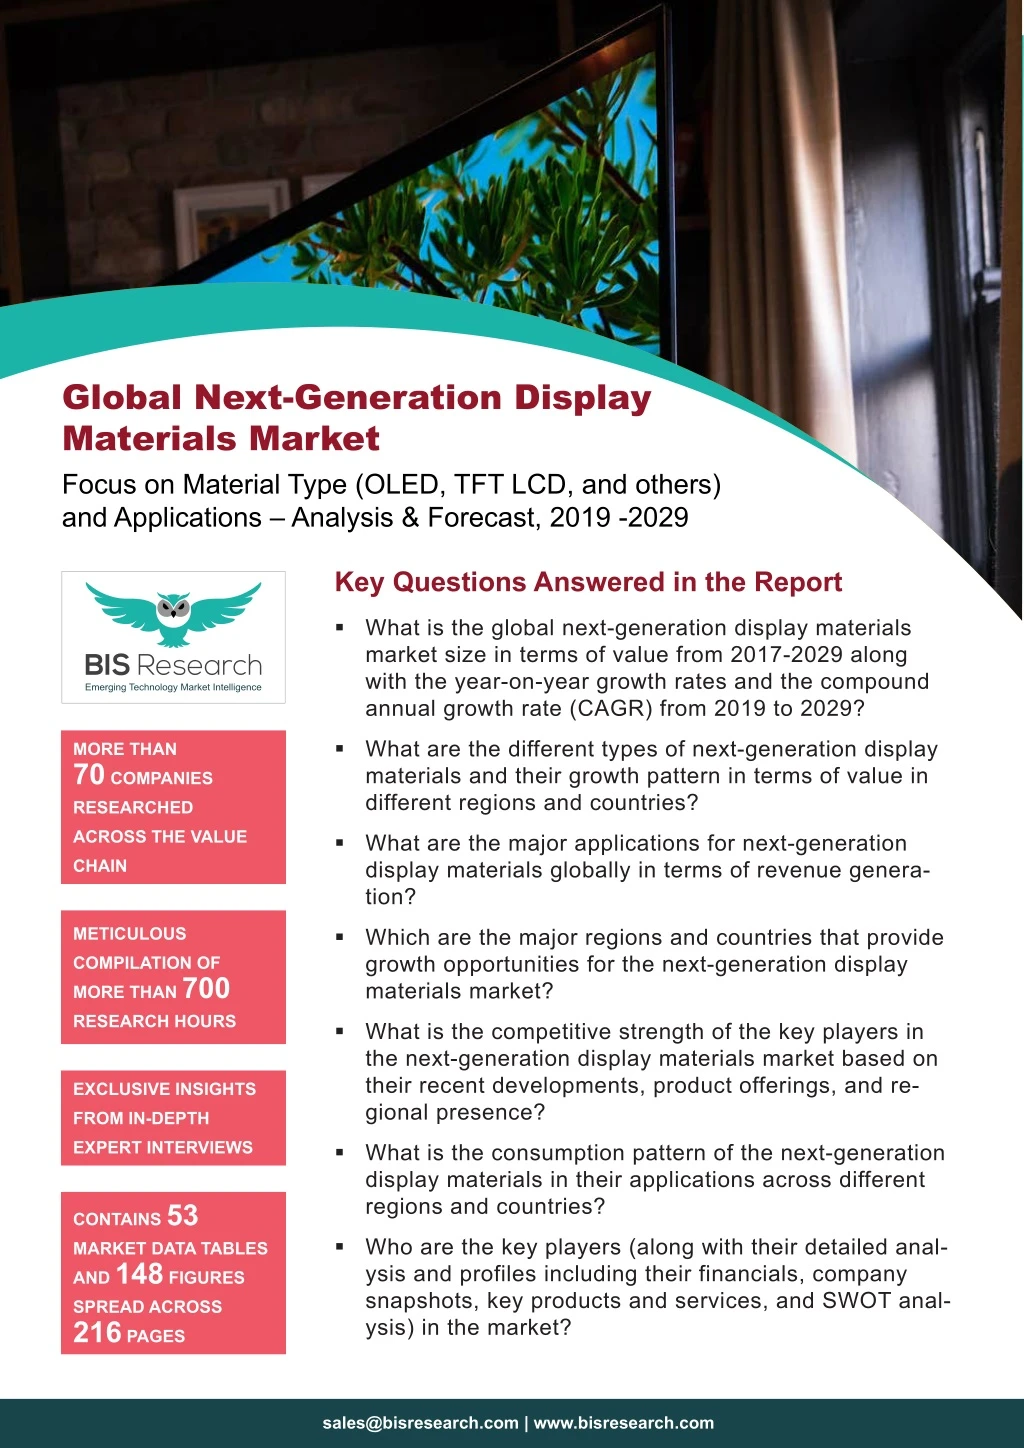
Global Next-Generation Display Materials Market Focus on Material Type (OLED, TFT LCD, and others) and Applications – Analysis & Forecast, 2019 -2029 Key Questions Answered in the Report What is the global next-generation display materials market size in terms of value from 2017-2029 along with the year-on-year growth rates and the compound annual growth rate (CAGR) from 2019 to 2029? What are the different types of next-generation display materials and their growth pattern in terms of value in different regions and countries? MORE THAN 70 COMPANIES RESEARCHED ACROSS THE VALUE What are the major applications for next-generation display materials globally in terms of revenue genera- tion? CHAIN METICULOUS Which are the major regions and countries that provide growth opportunities for the next-generation display materials market? COMPILATION OF MORE THAN 700 RESEARCH HOURS What is the competitive strength of the key players in the next-generation display materials market based on their recent developments, product offerings, and re- gional presence? EXCLUSIVE INSIGHTS FROM IN-DEPTH EXPERT INTERVIEWS What is the consumption pattern of the next-generation display materials in their applications across different regions and countries? CONTAINS 53 MARKET DATA TABLES AND 148 FIGURES SPREAD ACROSS 216 PAGES Who are the key players (along with their detailed anal- ysis and profiles including their financials, company snapshots, key products and services, and SWOT anal- ysis) in the market? sales@bisresearch.com | www.bisresearch.com
Table of Contents Market Drivers Market Restraints Market Opportunities SCOPE & RESEARCH METHODOLOGY Report Scope Global Next-Generation Display Materials Market Research Methodology Key Market Development and Strategies Leading Players Active in the Next-Generation Display Materials Market COMPANY PROFILES Doosan Corporation DowDuPont Inc. Idemitsu Kosan Co., Ltd. MARKET DYNAMICS OLED Display Materials Supply Chain Micro LED Display Materials Supply Chain Opportunity Matrix Analysis Country Share Analysis Merck Group Nanosys Inc. Nanoco Group plc COMPETITIVE LANDSCAPE Novaled GmbH PPG Industries Inc. INDUSTRY ANALYSIS Samsung SDI Co Sharp Corporation Assumptions Limitations Market Overview OLED TFT-LCD Others GLOBAL NEXT-GENERATION DISPLAY MATERIALS MARKET (BY TYPE), $BILLION, 2017-2029 TORAY Industries, Inc. Universal Display Corporation GLOBAL NEXT-GENERATION DISPLAY MATERIALS MARKET (BY APPLICATION), $BILLION, 2017-2029 eLux, Inc. JBD Inc. Optovate Limited Smartphones Televisions and Monitors Smartwatches Automotive Displays Laptops and Tablets Others GLOBAL NEXT-GENERATION DISPLAY MATERIALS MARKET (BY REGION), $BILLION, 2017-2029 Quantum Materials Corporation Plessey Semiconductors VueReal Inc. CUSTOMER PROFILES Apple Inc. Samsung Display North America Europe Asia-Pacific (APAC) Rest-of-the-World (RoW) LG Display Co., Ltd. VIEW COMPLETE TABLE OF CONTENT sales@bisresearch.com | www.bisresearch.com
List of Tables 1. Global Next-Generation Display Materials Market Snapshot, 2018 and 2029 2. Impact Analysis of Drivers 3. OLED Types and their Applications 4. Impact Analysis of Restraints 5. Highlights of Different Material Types 6. Global Next-Generation Display Materials Market (by Type), $Billion, 2017-2029 7. Global Next-Generation Display Materials Market (by OLED Type), $Billion, 2017-2029 8. Global Next-Generation Display Materials Market (by TFT LCD Type), $Billion, 2017-2029 9. Global Next-Generation Display Materials Market (by Application), $Billion, 2017-2029 10. Global Next-Generation Display Materials Market (by Region), $Billion, 2017-2029 11. North America Next-Generation Display Materials Market (by Material), $Billion, 2016-2028 12. North America Next-Generation Display Materials Market (by Application), $Billion, 2016-2028 13. North America Next-Generation Display Materials Market (by Country), $Billion, 2016-2028 14. U.S. Next-Generation Display Materials Market (by Material), $Billion, 2017-2029 15. U.S. Next-Generation Display Materials Market (by Application), $Billion, 2017-2029 16. Canada Next-Generation Display Materials Market (by Material), $Billion, 2017-2029 17. Canada Next-Generation Display Materials Market (by Application), $Billion, 2017-2029 18. Mexico Next-Generation Display Materials Market (by Material), $Billion, 2017-2029 19. Mexico Next-Generation Display Materials Market (by Application), $Billion, 2017-2029 20. Europe Next-Generation Display Materials Market (by Material), $Billion, 2016-2028 21. Europe Next-Generation Display Materials Market (by Application), $Billion, 2017-2029 22. Europe Next-Generation Display Materials Market (by Country), $Billion, 2016-2028 23. Germany Next-Generation Display Materials Market (by Materials), $Billion, 2017-2029 24. Germany Next-Generation Display Materials Market (by Application), $Billion, 2017-2029 25. France Next-Generation Display Materials Market (by Material), $Billion, 2017-2029 26. France Next-Generation Display Materials Market (by Application), $Billion, 2017-2029 27. U.K. Next-Generation Display Materials Market (by Materials), $Billion, 2017-2029 28. U.K. Next-Generation Display Materials Market (by Application), $Billion, 2017-2029 29. Rest-of-Europe Next-Generation Display Materials Market (by Materials), $Billion, 2017-2029 30. Rest-of-Europe Next-Generation Display Materials Market (by Application), $Billion, 2016-2028 31. Asia-Pacific Next-Generation Display Materials Market (by Material), $Billion, 2017-2029 32. Asia-Pacific Next-Generation Display Materials Market (by Application), $Billion, 2017-2029 33. Asia-Pacific Next-Generation Display Materials Market (by Country), $Billion, 2017-2029 34. China Next-Generation Display Materials Market (by Materials), $Billion, 2017-2029 35. China Next-Generation Display Materials Market (by Application), $Billion, 2017-2029 36. Taiwan Next-Generation Display Materials Market (by Materials), $Billion, 2017-2029 37. Taiwan Next-Generation Display Materials Market (by Application), $Billion, 2017-2029 38. Japan Next-Generation Display Materials Market (by Materials), $Billion, 2017-2029 39. Japan Next-Generation Display Materials Market (by Application), $Billion, 2017-2029 40. South Korea Next-Generation Display Materials Market (by Materials), $Billion, 2017-2029 41. South Korea Next-Generation Display Materials Market (by Application), $Billion, 2017-2029 42. Rest-of-Asia-Pacific Next-Generation Display Materials Market (by Materials), $Billion, 2017-2029 43. Rest-of-Asia-Pacific Next-Generation Display Materials Market (by Application), $Billion, 2017-2029 44. RoW Next-Generation Display Materials Market (by Material), $Billion, 2017-2029 45. RoW Next-Generation Display Materials Market (by Application), $Billion, 2017-2029 46. RoW Next-Generation Display Materials Market (by Country), $Billion, 2017-2029 47. Middle East and Africa Next-Generation Display Materials Market (by Materials), $Billion, 2017-2029 48. Middle East and Africa Next-Generation Display Materials Market (by Application), $Billion, 2017-2029 49. South America Next-Generation Display Materials Market (by Materials), $Billion, 2017-2029 50. South America Next-Generation Display Materials Market (by Application), $Billion, 2017-2029 51. Apple Inc.: Product Portfolio 52. Samsung Display Co. Ltd.: Product Portfolio 53. LG Display Co., Ltd.: Product Portfolio sales@bisresearch.com | www.bisresearch.com
List of Figures 1. Global Next-Generation Display Materials Market Snapshot 2. Global Next-Generation Display Materials Market (by Material Type) 3. Global Next-Generation Display Materials Market (by Application) 4. Global Next-Generation Display Materials Market (by Application), $Billion, 2016, 2017, & 2028 5. Global Next-Generation Display Materials Market (by Region), 2018 6. Market Dynamics: Next-Generation Display Material Market 7. Manufacturing Cost of Display Panels ($) 8. Strategies Adopted by the Key Players 9. Share of Key Market Strategies and Developments, 2016-2019 10. Partnerships, Collaborations, and Joint Ventures Development Share of Companies 11. Business Expansion Share of Key Companies 12. Product Launches Share of Key Companies 13. Mergers and Acquisitions Development Share of Companies 14. Other Development Share of Companies 15. Leading Player Analysis in OLED Display Materials Market 16. OLED Display Materials Supply Chain 17. Global Next-Generation Display Materials Market Opportunity Matrix (by Region), $Billion, 2017-2029 18. Country Share Analysis of Global Next-Generation Display Materials Market, 2018 19. Global Next-Generation Display Materials Market (by Type) 20. Global Next-Generation Display Materials Market (by Type), 2017, 2018, and 2029 21. OLED Display Materials in Global Next-Generation Display Material Market, 2017-2029 22. OLED Display by Materials 23. TFT LCD Display Materials in Global Next-Generation Display Materials Market, 2017-2029 24. TFT LCD Display by Materials 25. Other Display Materials in Global Next-Generation Display Material Market, 2017-2029 26. Global Next-Generation Display Materials Market (by Application) 27. Global Next-Generation Display Materials Market (by Application), 2017, 2018, and 2029 28. Global Demand for Next-Generation Display Materials in Smartphones, $Billion, 2016-2028 29. Demand for Next-Generation Display Materials in the Television and Monitors, $Billion, 2017-2029 30. Global Demand for Next-Generation Display Materials in Smartwatch, $Billion, 2017-2029 31. Global Demand for Next-Generation Display Materials in Automotive Display, $Billion, 2016-2028 32. Global Demand for Next-Generation Display Materials in Laptops and Tablets Display, $Billion, 2017-2029 33. Global Demand for Next-Generation Display Materials in Other Display Devices, $Billion, 2017-2029 34. Global Next-Generation Display Materials Market – Regional Segmentation 35. Global Next-Generation Display Materials Market (by Region), 2018 and 2029 36. North America Next-Generation Display Materials Market (by Material), $Billion, 2017, 2018, and 2029 37. North America Next-Generation Display Materials Market (by Application), $Billion, 2018 and 2029 38. North America Next-Generation Display Materials Market (by Country), $Billion, 2018 and 2029 39. U.S. Next-Generation Display Materials Market, $Billion, 2017-2029 40. Canada Next-Generation Display Materials Market, $Billion, 2017-2029 41. Mexico Next-Generation Display Materials Market, $Billion, 2017-2029 42. Europe Next-Generation Display Materials Market (by Material), $Billion, 2017, 2018, and 2028 43. Europe Next-Generation Display Materials Market (by Application), $Billion, 2018 and 2029 44. Europe Next-Generation Display Materials Market (by Country), $Billion, 2018 and 2029 45. Germany Next-Generation Display Materials Market, $Billion, 2017-2029 46. France Next-Generation Display Materials Market, $Billion, 2017-2029 47. U.K. Next-Generation Display Materials Market, $Billion, 2017-2029 48. Rest-of-Europe Next-Generation Display Materials Market, $Billion, 2017-2029 49. Asia-Pacific Next-Generation Display Materials Market (by Material), $Billion, 2017, 2018, and 2028 50. Asia-Pacific Next-Generation Display Materials Market (by Application), $Billion, 2018 and 2029 51. Asia-Pacific Next-Generation Display Materials Market (by Country), $Billion, 2018 and 2029 52. China Next-Generation Display Materials Market, $Billion, 2017-2029 53. Taiwan Next-Generation Display Materials Market, sales@bisresearch.com | www.bisresearch.com
List of Figures $Billion, 2017-2029 54. Japan Next-Generation Display Materials Market, $Billion, 2017-2029 55. South Korea Next-Generation Display Materials Market, $Billion, 2017-2029 56. Rest-of-Asia-Pacific Next-Generation Display Materials Market, $Billion, 2017-2029 57. RoW Next-Generation Display Materials Market (by Material), $Billion, 2017, 2018 and 2028 58. RoW Next-Generation Display Materials Market (by Application), $Billion, 2018 and 2029 59. RoW Next-Generation Display Materials Market (by Country), $Billion, 2018 and 2028 60. Middle East and Africa Next-Generation Display Materials Market, $Billion, 2017-2029 61. South America Next-Generation Display Materials Market, $Billion, 2017-2029 62. Share of Key Companies 63. Doosan Corporation: Product Portfolio for Next- Generation Display Materials Market 64. Doosan Corporation.: Overall Financials, 2015-2017 65. Doosan Corporation: Net Revenue (by Business Segment), 2015-2017 66. Doosan Corporation: Research and Development Analysis 67. Doosan Corporation: SWOT Analysis 68. DowDuPont Inc.: Product Portfolio for Next-Generation Display Materials Market 69. DowDuPont Inc.: Overall Financials, 2015-2017 70. DowDuPont Inc.: Net Revenue (by Region), 2017 71. DowDuPont Inc.: Net Revenue (by Business Segment), 2015-2017 72. DowDuPont Inc.: Research and Development Analysis 73. DowDuPont Inc.: SWOT Analysis 74. Idemitsu Kosan Co., Ltd.: Product Portfolio for Next- Generation Display Materials Market 75. Idemitsu Kosan Co., Ltd.: Overall Financials, 2015-2017 76. Idemitsu Kosan Co., Ltd.: Net Revenue (by Region), 2015-2017 77. Idemitsu Kosan Co., Ltd.: Net Revenue (by Business Segment), 2015-2017 78. Idemitsu Kosan Co., Ltd.: Research and Development Analysis 79. Idemitsu Kosan Co., Ltd.: SWOT Analysis 80. Merck Group: Product Portfolio for Next-Generation Display Materials Market 81. Merck Group: Overall Financials, 2016-2018 82. Merck Group: Net Revenue (by Region), 2016-2018 83. Merck Group: Net Revenue (by Business Segment), 2016-2018 84. Merck Group: Research and Development Analysis 85. Merck Group: SWOT Analysis 86. Nanosys Inc: Product Portfolio for Next-Generation Display Materials Market 87. Nanosys Inc.: SWOT Analysis 88. Nanoco Group plc: Product Portfolio for Next- Generation Display Materials Market 89. Nanoco Group: Overall Financials, 2016-2018 90. Nanoco Group plc: Net Revenue (by Region), 2016-2018 91. Nanoco Group plc: Research and Development Analysis 92. Nanoco Group plc: SWOT Analysis 93. Novaled: Product Portfolio for Next-Generation Display Materials Market 94. Novaled: SWOT Analysis 95. PPG Industries, Inc.: Product Portfolio for Next- Generation Display Materials Market 96. PPG Industries, Inc.: Overall Financials, 2015-2017 97. PPG Industries, Inc.: Net Revenue (by Region), 2015-2017 98. PPG Industries, Inc.: Net Revenue (by Business Segment), 2015-2017 99. PPG Industries, Inc.: Research and Development Analysis 100. PPG Industries, Inc.: SWOT Analysis 101. Samsung SDI Co.: Product Portfolio for Next- Generation Display Materials Market 102. Samsung SDI Co.: Overall Financials, 2016-2018 103. Samsung SDI Co.: Net Revenue (by Region), 2016-2018 104. Samsung SDI Co.: Net Revenue (by Business Segment), 2017-2018 105. Samsung SDI Co.: Net Revenue (by Business Segment), 2016 106. Samsung SDI Co.: Research and Development Analysis 107. Samsung SDI Co.: SWOT Analysis 108. Sharp Corporation: Product Portfolio for Next- Generation Display Materials Market 109. Sharp Corporation: Overall Financials, 2016-2018 110. Sharp Corporation: Net Revenue (by Region), 2016-2018 111. Sharp Corporation: Net Revenue (by Business Segment), 2016-2018 sales@bisresearch.com | www.bisresearch.com
List of Figures 112. Sharp Corporation Research and Development Analysis 113. Sharp Corporation: SWOT Analysis 114. Toray Industries, Inc.: Product Portfolio for Next- Generation Display Materials Market 115. Toray Industries Inc.: Overall Financials, 2016-2018 116. Toray Industries, Inc.: Net Revenue (by Region), 2016-2018 117. Toray Industries, Inc.: Net Revenue (by Business Segment), 2016-2018 118. Toray Industries, Inc.: Research and Development Analysis 119. Toray Industries, Inc.: SWOT Analysis 120. Universal Display Corporation: Product Portfolio for Next-Generation Display Materials Market 121. Universal Display Corporation: Overall Financials, 2015-2017 122. Universal Display Corporation: Net Revenue (by Region), 2015-2017 123. Universal Display Corporation: Net Revenue (by Business Segment), 2015-2017 124. Universal Display Corporation: Material Sales (by Business Segment), 2016-2017 125. Universal Display Corporation: Research and Development Analysis 126. Universal Display Corporation: SWOT Analysis 127. eLux, Inc.: Product Portfolio for Next-Generation Display Materials Market 128. JBD Inc.: Product Portfolio for Next-Generation Display Materials Market 129. Optovate Limited: Product Portfolio for Next- Generation Display Materials Market 130. Quantum Materials Corporation: Product Portfolio for Next-Generation Display Materials Market 131. Plessey Semiconductor: Product Portfolio for Next- Generation Display Materials Market 132. VueReal Inc.: Product Portfolio for Next-Generation Display Materials Market 133. Apple Inc.: Overall Financials, 2016-2018 134. Apple Inc.: Net Revenue by Business Segment, 2016-2018 135. Apple Inc.: Net Revenue by Region, 2016-2018 136. Apple Inc.: SWOT Analysis 137. Samsung Display Co., Ltd.: SWOT Analysis 138. LG Display Co., Ltd.: Overall Financials, 2016-2018 139. LG Display Co.: Net Revenue by Business Segment, 2016-2018 140. LG Display Co., Inc.: Net Revenue by Region, 2016-2018 141. LG Display Co.: SWOT Analysis 142. Global Next-Generation Display Materials Market Scope 143. Parameters for Market Estimation 144. Report Design 145. Primary Interviews Breakdown (by Player, Designation, and Region) 146. Sources of Secondary Research 147. Data Triangulation 148. Top-Down and Bottom-Up Approach sales@bisresearch.com | www.bisresearch.com
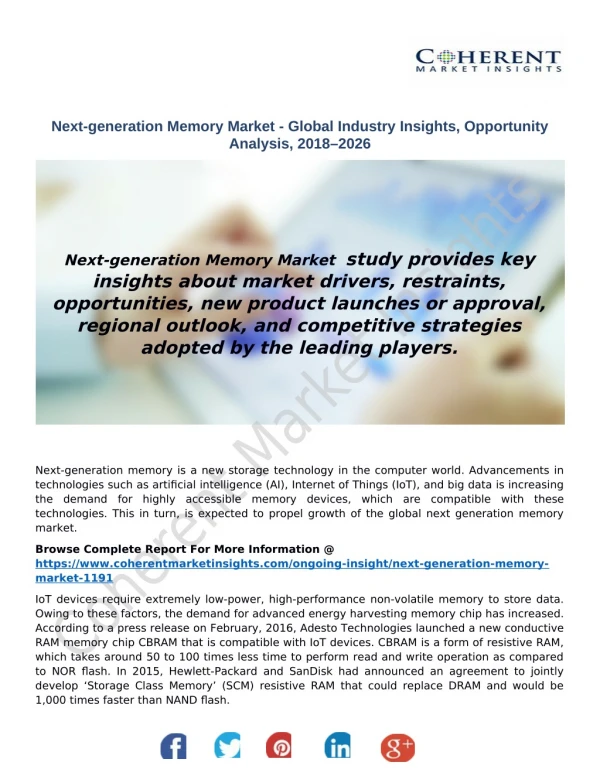
Research Scope & BIS Methodology 1. Scope of the Report This report is intended to be a comprehensive study of the global next-generation display materials market. The report focuses largely on providing market information for material types, covering different segments including type, sub- types, application, and region. Further, “2019-2029” has been considered the forecast period for the estimation of the next-generation display materials market size in different sections of the report. 2. Global Next-Generation Display Materials Market Research Methodology The research methodology adopted for this specific study includes a mix of data collected from primary and secondary sources. The research exhaustively uses both primary sources (in-house experts, industry leaders, and market players) and secondary sources (a host of paid and unpaid databases) along with analytical tools to build forecast and predictive models. Figure 1: Research Methodology List of Tables Scope Definition Research Design Market Study Qualitative Quantitative Primary Interviews/ Secondary Research Top Down and Bottom Up Primary & Secondary Data Report Writing Data Validation Data Analysis Data Collection sales@bisresearch.com | www.bisresearch.com
Research Scope & BIS Methodology Primary Data Sources The primary sources involve the industry experts from the next-generation display materials market including the suppliers, manufacturers, distributors, administrators, solution providers, and technology developers related to the various segments of the industry’s value chain. Primary resources, such as CEOs, vice presidents, marketing directors and technology directors, and PhDs, have been interviewed to obtain and verify both qualitative and quantitative aspects of this research study. The research includes interviews with participants throughout the value chain. An extensive questionnaire was shared to get insights from the experts who didn’t participate in discussions. In some cases where information was not available, the Delphi method has been used to arrive at a mutual consent with BIS consultants. The key data points taken from primary sources include: Validation and triangulation of all the numbers and graphs Validation of reports segmentation and key qualitative findings Understanding the competitive landscape Validation of the numbers of the various markets for different type, sub-types, and application Percentage split for different region Figure 2: Secondary Data Sources In the extensive secondary research process for this study, several hundreds of secondary sources such as certified publications, articles from recognized authors, white papers, annual reports of companies, gold and silver standard websites, directories, and major databases have been used to identify and collect information to analyze the market from both from the qualitative and quantitative standpoints. The following figure exhibits key secondary data sources considered for this research study: sales@bisresearch.com | www.bisresearch.com
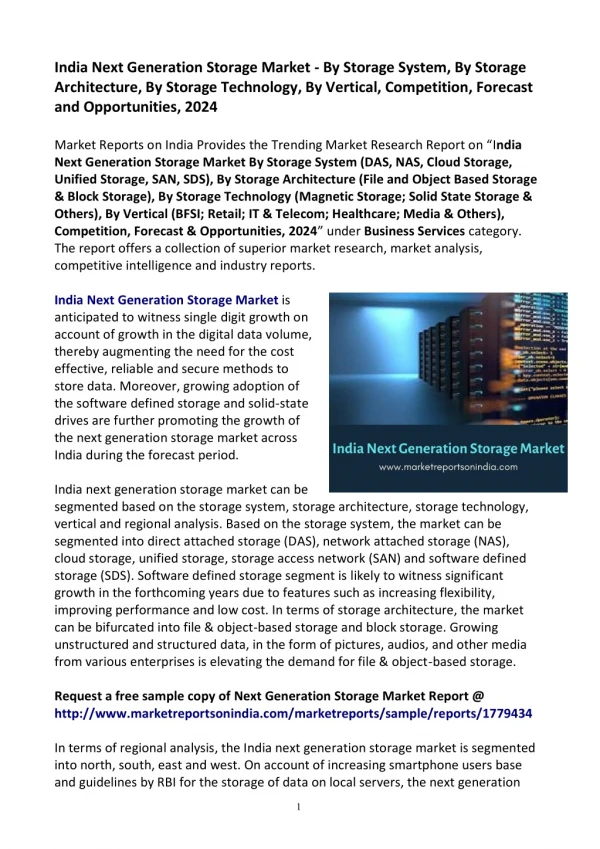
Research Scope & BIS Methodology Figure 2: Data Triangulation The following figure exhibits data triangulation considered: List of Tables BIS Research Internal Repository Key Players Competitive Landscape Opportunities/Challenges Market Size and Market Share (2018) Influencing Factors Market Estimates Geographical Analysis Bis Research Internal Repository DATA TRIANGULATION Primary Sources Secondary Sources Primary Sources Secondary Sources Demand Side Demand Side Annual Reports of Key Industrial Players SEC Filings 10K reports Investor Presentations Journals Press Releases Paid and Unpaid Databases OLED info Micro-LED info Nsf.gov Next-Generation Display Materials End User: Smartphone Manufacturers TV and Monitor Manufacturers Laptops and Tablets Automotive Display Panel Manufacturers Others Supply Side Senior Managements of Major Companies In the Next-Generation Display Materials Market Tier II Players Distributors Retailers REQUEST FOR SAMPLE sales@bisresearch.com | www.bisresearch.com
BIS Research 39111 Paseo Padre PKWY STE 313, Fremont CA 94538-1686, Tel: +1-510-404-8135 Global Delivery Centre Tapasya Corp Heights, Subarea, Sector 126, Noida, NCR-201303 India Tel: +91 120 4261540 / +91 120 4261544 To know more about us, please visit our website: bisresearch.com For other queries contact: sales@bisresearch.com sales@bisresearch.com | www.bisresearch.com sales@bisresearch.com | www.bisresearch.com