Download
1 / 12
120 likes | 124 Views
Molecular diagnostics utilized for this application contribute significantly to the overall size of the global molecular diagnostics market. Further, with emerging applications such as companion diagnostics and liquid biopsy, the global molecular diagnostics market (by application) is anticipated to be highly dynamic and inclusive in the years to come.

E N D
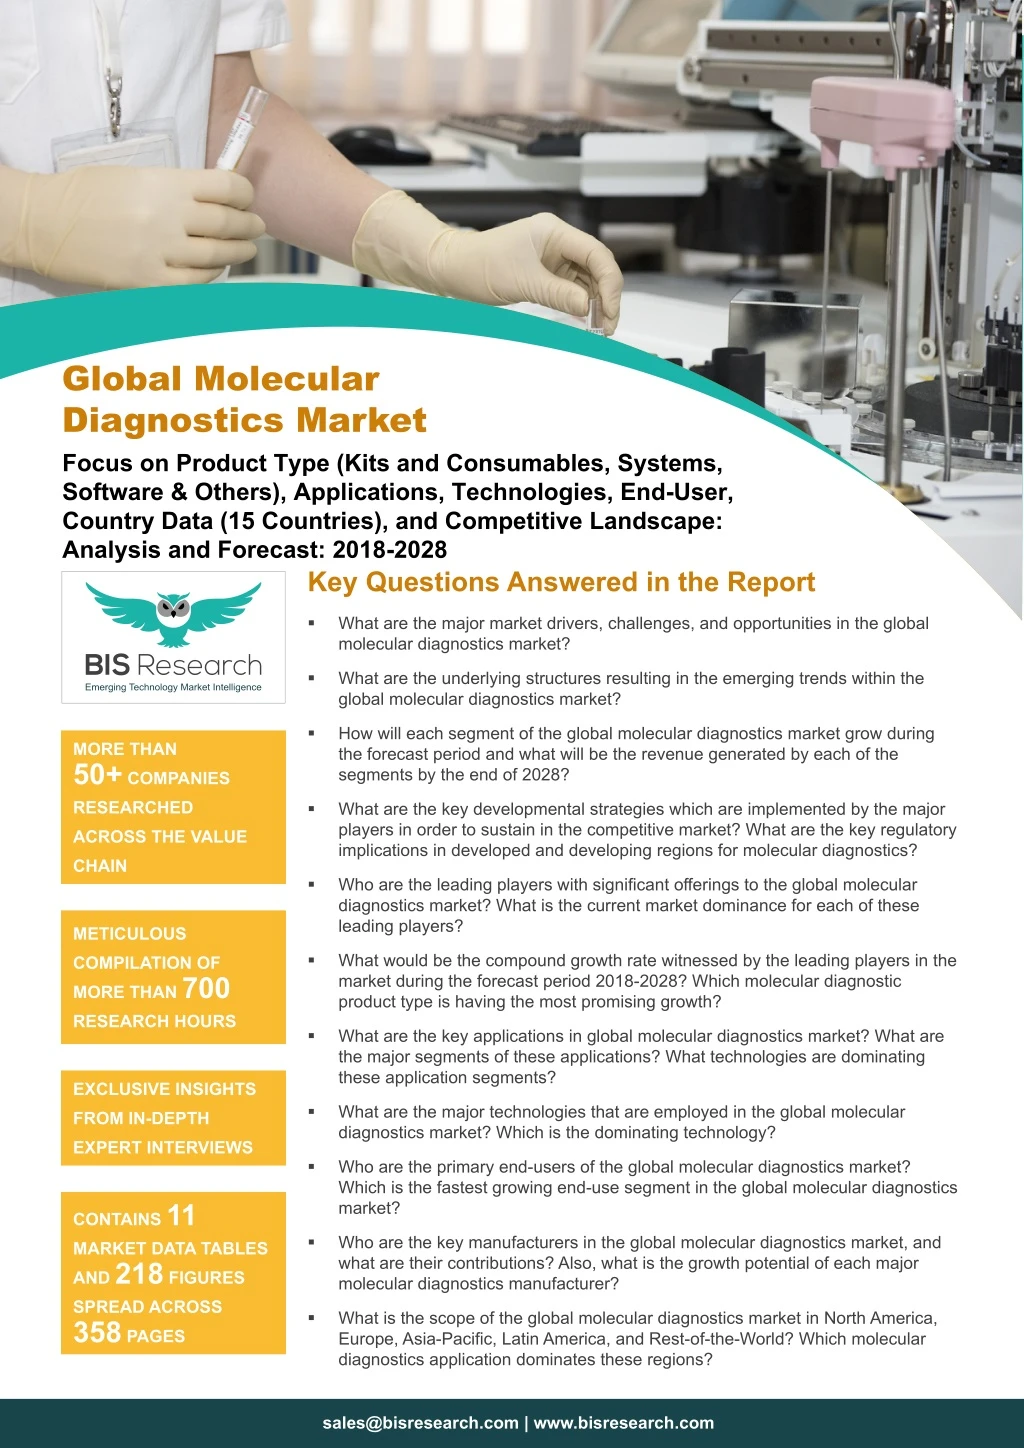
Global Molecular Diagnostics Market Focus on Product Type (Kits and Consumables, Systems, Software & Others), Applications, Technologies, End-User, Country Data (15 Countries), and Competitive Landscape: Analysis and Forecast: 2018-2028 Key Questions Answered in the Report What are the major market drivers, challenges, and opportunities in the global molecular diagnostics market? What are the underlying structures resulting in the emerging trends within the global molecular diagnostics market? How will each segment of the global molecular diagnostics market grow during the forecast period and what will be the revenue generated by each of the segments by the end of 2028? MORE THAN 50+ COMPANIES RESEARCHED What are the key developmental strategies which are implemented by the major players in order to sustain in the competitive market? What are the key regulatory implications in developed and developing regions for molecular diagnostics? ACROSS THE VALUE CHAIN Who are the leading players with significant offerings to the global molecular diagnostics market? What is the current market dominance for each of these leading players? METICULOUS What would be the compound growth rate witnessed by the leading players in the market during the forecast period 2018-2028? Which molecular diagnostic product type is having the most promising growth? COMPILATION OF MORE THAN 700 RESEARCH HOURS What are the key applications in global molecular diagnostics market? What are the major segments of these applications? What technologies are dominating these application segments? EXCLUSIVE INSIGHTS What are the major technologies that are employed in the global molecular diagnostics market? Which is the dominating technology? FROM IN-DEPTH EXPERT INTERVIEWS Who are the primary end-users of the global molecular diagnostics market? Which is the fastest growing end-use segment in the global molecular diagnostics market? CONTAINS 11 MARKET DATA TABLES AND 218 FIGURES SPREAD ACROSS 358 PAGES Who are the key manufacturers in the global molecular diagnostics market, and what are their contributions? Also, what is the growth potential of each major molecular diagnostics manufacturer? What is the scope of the global molecular diagnostics market in North America, Europe, Asia-Pacific, Latin America, and Rest-of-the-World? Which molecular diagnostics application dominates these regions? sales@bisresearch.com | www.bisresearch.com
Table of Contents Introduction Market Definition Historical Perspective Significant Technologies Classification of Molecular Diagnostics Global Footprint Future Potential SCOPE & RESEARCH METHODOLOGY Report Scope Human Molecular Diagnostics Market: Research Methodology Overview Iceberg Analysis – Global Molecular Diagnostics Market Impact Analysis Market Drivers Market Restraints Opportunities MARKET OVERVIEW COMPANY PROFILES Key Strategies and Developments Market Share Analysis Growth Share Analysis (Opportunity Mapping) Industry Attractiveness MARKET DYNAMICS Overview Abbott Laboratories Legal Requirements and Framework in the U.S. Legal Requirements and Framework in Europe Legal Requirements and Framework in Asia-Pacific Agilent Technologies, Inc. COMPETITIVE LANDSCAPE Becton, Dickinson and Company bioMérieux S.A. REGULATORY FRAMEWORK Bio-Rad Laboratories, Inc. Overview Kits and Consumables Systems Software and Other Products GLOBAL MOLECULAR DIAGNOSTICS MARKET (BY PRODUCT) Cynvenio Biosystems, Inc. Danaher Corporation Overview Core Molecular Diagnostics Non-Invasive Prenatal Testing (NIPT) Companion Diagnostics (CDx) Liquid Biopsy Others GLOBAL MOLECULAR DIAGNOSTICS MARKET (BY APPLICATION) F. Hoffmann-La Roche AG GUARDANT HEALTH, INC GLOBAL MOLECULAR DIAGNOSTICS MARKET (BY TECHNOLOGY) Overview Polymerase Chain Reaction (PCR) Sequencing Microarray In-situ Hybridization (ISH) Immunohistochemistry (IHC) Nucleic Acid Amplification Isothermal Amplification Others Illumina, Inc. Invivoscribe Technologies, Inc. GLOBAL MOLECULAR DIAGNOSTICS MARKET (BY END-USER) MolecularMD Corporation GLOBAL MOLECULAR DIAGNOSTICS MARKET (BY END-USER) QIAGEN N.V. Siemens Healthineers, Inc. Overview Hospitals Diagnostic Centers Out-Patient Clinics/General Practitioners Research Laboratories Thermo Fisher Scientific Inc. QuantuMDx Group Ltd. HTG Molecular Diagnostics, Inc. Overview Hospitals Diagnostic Centers Out-Patient Clinics/General Practitioners Research Laboratories VIEW COMPLETE TABLE OF CONTENT sales@bisresearch.com | www.bisresearch.com
List of Tables 1. Impact Analysis of Market Drivers 10. Latin America Molecular Diagnostics Market (by Application), 2017-2028 2. Impact Analysis of Market Restraints 11. RoW Molecular Diagnostics Market (by Application), 2017-2028 3. Classification rules of IVDs under the IVDR 4. Registration Criteria for IVD Medical Devices as per the CFDA 5. Genetic Tests for Certain Applications 6. Examples of Molecular Diagnostics in Cancer 7. North America Molecular Diagnostics Market (by Application), 2017-2028 8. Europe Molecular Diagnostics Market (by Application), 2017-2028 9. APAC Molecular Diagnostics Market (by Application), 2017-2028 List of Figures 1. Global Precision Medicine Market, 2016 and 2020 13. Classification of Molecular Diagnostics 2. Impact of Market Drivers and Market Restraints on the Global Molecular Diagnostics Market 14. Global Molecular Diagnostics (MDx) Market, 2017- 2028 3. Global Molecular Diagnostics Market Snapshot 15. Iceberg Analysis - Global Molecular Diagnostics Market 4. Dominating Segments of the Global Molecular Diagnostics Market, 2017 and 2028 16. Number of Deaths by Top 18 Infectious Diseases, 2015 5. Global Molecular Diagnostics Market (by Product), 2017 and 2028 17. Strategies to Integrate Personalized Medicine for Routine Healthcare Procedures 6. Global Molecular Diagnostics Market (by Product), 2017 18. Benefits of Multiplexing Reactions 7. Global Molecular Diagnostics Market (by Product), 2028 19. Share of Key Developments and Strategies, January 2016 - December 2018 8. Global Molecular Diagnostics Market (by Technology), 2017 and 2028 20. Synergistic Activities Share (by Companies), January 2016 - December 2018 9. Global Molecular Diagnostics Market (by Technology), 2017 and 2028 21. Approvals Share (by Companies), January 2016 - December 2018 10. Global Molecular Diagnostics Market (by Technology), 2017 and 2028 22. Product Launches and Enhancements Share (by Companies), January 2016 - December 2018 11. Role of Diagnostics in Healthcare 23. Acquisitions Share (by Companies), January 2016 - December 2018 12. Evolution of Molecular Diagnostics sales@bisresearch.com | www.bisresearch.com
List of Figures 24. Market Share Analysis for the Global Molecular Diagnostics Market, 2016 48. Global Molecular Diagnostics Market (by Infectious Diseases), 2017-2028 25. Market Share Analysis for the Global Molecular Diagnostics Market, 2017 49. Global Molecular Diagnostics Market (by Infectious Diseases), 2017 and 2028 26. Growth Share Matrix (Opportunity Mapping Matrix) for Global Molecular Diagnostics Market (by companies), 2016 50. Global Molecular Diagnostics Market (by Infectious Diseases, by Technology), 2017 and 2028 51. Global Molecular Diagnostics Market (by Genetic Testing), 2017-2028 27. Growth Share Matrix (Opportunity Mapping Matrix) for Global Molecular Diagnostics Market (by companies), 2017 52. Global Molecular Diagnostics Market (by Genetic Testing, by Technology), 2017 and 2028 28. Overall Industry Attractiveness, 2018 and 2028 53. Global Molecular Diagnostics Market (by Blood Donor Screening), 2017-2028 29. Overall Impact of Bargaining Power of Suppliers 30. Overall Impact of Bargaining Power of Buyers 54. Clinical Uses of Molecular Diagnostics in Cancer 31. Overall Impact of Threat of New Entrants 55. Global Molecular Diagnostics Market (by Cancer), 2017-2028 32. Overall Impact of Threat of Substitute Products 56. Global Molecular Diagnostics Market (by Oncology), 2017 and 2028 33. Overall Impact of Intensity of Competitive Rivalry 34. Components Considered for Clinical Evidence as per the IVDR 57. Global Molecular Diagnostics Market (by Oncology, by Technology), 2017 and 2028 35. Global Molecular Diagnostics Market (by Product) 58. Global Molecular Diagnostics Market (by HLA Testing), 2017-2028 36. Global Molecular Diagnostics Market (by Product), 2017 and 2028 59. Global Molecular Diagnostics Market (by Other Applications), 2017-2028 37. General Workflow of a Molecular Diagnostic Kit 38. Global Molecular Diagnostics Market (by Kits and Consumables), 2017-2028 60. Global Molecular Diagnostics Market (by Companion Diagnostics), 2017 and 2028 39. Global Molecular Diagnostics Market (by Systems), 2017-2028 61. Global Molecular Diagnostics Market (by NIPT, by Technology), 2017 and 2028 40. Global Molecular Diagnostics Market (by Systems, by Type), 2017-2028 62. Global Molecular Diagnostics Market (by Companion Diagnostics), 2017 and 2028 41. Aspects of Software Development 63. Global Molecular Diagnostics Market (by Companion Diagnostics, by Technology), 2017 and 2028 42. Global Molecular Diagnostics Market (by Software and Other Products), 2017-2028 64. Global Molecular Diagnostics Market (by Liquid Biopsy), 2017 and 2028 43. Global Molecular Diagnostics Market (by Application) 65. Global Molecular Diagnostics Market (by Liquid Biopsy, by Technology), 2017 and 2028 44. Global Molecular Diagnostics Market (by Application), 2017 66. Global Molecular Diagnostics Market (by Technology) 45. Global Molecular Diagnostics Market (by Application), 2028 67. Global Molecular Diagnostics Market (by Technology), 2017 46. Global Molecular Diagnostics Market (by Core MDx Applications), 2017 and 2028 68. Global Molecular Diagnostics Market (by PCR), 2017-2028 47. Nucleic Acid Testing Techniques for Infectious Diseases sales@bisresearch.com | www.bisresearch.com
List of Figures 69. Evolution of Sequencing for Molecular Diagnostics 91. Canada Molecular Diagnostics Market, 2017-2028 70. Global Molecular Diagnostics Market (by Sequencing), 2017-2028 92. Overview of Reimbursement Policies in Europe (Focus on Companion Diagnostics as well) 71. Global Molecular Diagnostics Market (by Microarray), 2017-2028 93. Europe Molecular Diagnostics Market, 2017-2028 94. Europe: Market Dynamics 72. Global Molecular Diagnostics Market (by ISH), 2017-2028 95. Europe Molecular Diagnostics Market (by Country), 2017-2028 73. Global Molecular Diagnostics Market (by IHC), 2017-2028 96. Germany Molecular Diagnostics Market, 2017-2028 97. France Molecular Diagnostics Market, 2017-2028 74. Global Molecular Diagnostics Market (by NAA), 2017-2028 98. Italy Molecular Diagnostics Market, 2017-2028 99. The U.K. Molecular Diagnostics Market, 2017-2028 75. Global Molecular Diagnostics Market (by Isothermal Amplification), 2017-2028 100. Spain Molecular Diagnostics Market, 2017-2028 76. Global Molecular Diagnostics Market (by Other Technologies), 2017-2028 101. The Netherlands Molecular Diagnostics Market, 2017-2028 77. Global Molecular Diagnostics Market (by End-User) 102. Rest-of-Europe Molecular Diagnostics Market, 2017- 2028 78. Global Molecular Diagnostics Market (by End-User), 2017 and 2028 103. Asia-Pacific Molecular Diagnostics Market, 2017- 2028 79. Global Molecular Diagnostics Market (by Hospitals), 2017-2028 104. APAC: Market Dynamics 80. Global Molecular Diagnostics Market (by Diagnostic Centers), 2017-2028 105. APAC Molecular Diagnostics Market (by Country), 2017-2028 81. Global Molecular Diagnostics Market (by Out-Patient Clinics/GPs), 2017-2028 106. Japan Molecular Diagnostics Market, 2017-2028 107. China Molecular Diagnostics Market, 2017-2028 82. Global Molecular Diagnostics Market (by Research Laboratories), 2017-2028 108. India Molecular Diagnostics Market, 2017-2028 109. Australia Molecular Diagnostics Market, 2017-2028 83. Global Molecular Diagnostics Market (by Region), 2017 and 2028 110. Singapore Molecular Diagnostics Market, 2017-2028 111. RoAPAC Molecular Diagnostics Market, 2017-2028 84. Global Molecular Diagnostics Market (by Region), 2017-2028 112. Latin America Molecular Diagnostics Market, 2017- 2028 85. Global Molecular Diagnostics Market Share (by Region), 2017 113. Latin America: Market Dynamics 86. Global Molecular Diagnostics Market Share (by Region), 2028 114. Latin America Molecular Diagnostics Market (by Country), 2017-2028 87. North America Molecular Diagnostics Market, 2017- 2028 115. Brazil Molecular Diagnostics Market, 2017-2028 116. Mexico Molecular Diagnostics Market, 2017-2028 88. North America: Market Dynamics 117. Rest-of-Latin America Molecular Diagnostics Market, 2017-2028 89. North America Molecular Diagnostics Market (by Country), 2017-2028 118. RoW Molecular Diagnostics Market, 2017-2028 90. The U.S. Molecular Diagnostics Market, 2017-2028 sales@bisresearch.com | www.bisresearch.com
List of Figures 119. Total Number of Companies Profiled 143. bioMérieux S.A.: Overall Product Portfolio 120. Abbott Laboratories: Overall Product Portfolio 144. bioMérieux S.A.: Overall Financials, 2015-2017 121. Abbott Laboratories: Overall Financials, 2015-2017 145. bioMérieux S.A.: Revenue (by Segment), 2015-2017 122. Abbott Laboratories: Revenue (by Segment), 2015- 2017 146. bioMérieux S.A.: Revenue (by Region), 2015-2017 147. bioMérieux S.A.: R&D Expenditure, 2015-2017 123. Abbott Laboratories: Revenue Split for Diagnostics, 2015-2017 148. bioMérieux S.A.: Revenue Forecast, 2015-2020 149. bioMérieux S.A.: SWOT Analysis 124. Abbott Laboratories: Revenue (by Region), 2015- 2017 150. Bio-Rad Laboratories, Inc.: Overall Product Portfolio 151. Bio-Rad Laboratories, Inc.: Overall Financials, 2015- 2017 125. Abbott Laboratories: R&D Expenditure, 2015-2017 126. Abbott Laboratories: Revenue Forecast, 2015-2020 152. Bio-Rad Laboratories, Inc.: Revenue (by Segment), 2015-2017 127. Abbott Laboratories: SWOT Analysis 128. Agilent Technologies, Inc.: Overall Product Portfolio 153. Bio-Rad Laboratories, Inc.: Revenue (by Region), 2015-2017 129. Agilent Technologies, Inc.: Overall Financials, 2015- 2017 154. Bio-Rad Laboratories, Inc.: R&D Expenditure, 2015- 2017 130. Agilent Technologies, Inc.: Revenue (by Segment), 2015-2017 155. Bio-Rad Laboratories, Inc.: SWOT Analysis 131. Agilent Technologies, Inc.: Revenue (by Region), 2015-2017 156. Cynvenio Biosystems, Inc.: Overall Product Portfolio 157. Cynvenio Biosystems, Inc.: SWOT Analysis 132. Agilent Technologies, Inc.: R&D Expenditure, 2015- 2017 158. Danaher Corporation: Overall Product Portfolio 159. Danaher Corporation: Overall Financials, 2015-2017 133. Agilent Technologies, Inc.: Revenue Forecast, 2015- 2020 160. Danaher Corporation: Revenue (by Segment), 2015- 2017 134. Agilent Technologies, Inc.: SWOT Analysis 161. Danaher Corporation: Revenue Split for Diagnostics, 2015-2017 135. Becton, Dickinson and Company: Overall Product Portfolio 162. Danaher Corporation: Revenue (by Region), 2015- 2017 136. Becton, Dickinson and Company: Overall Financials, 2015-2017 163. Danaher Corporation: R&D Expenditure, 2015-2017 137. Becton, Dickinson and Company: Revenue (by Segment), 2015-2017 164. Danaher Corporation: Revenue Forecast, 2015-2020 138. Becton, Dickinson and Company: Revenue Split for BD Life Sciences, 2015-2017 165. Danaher Corporation: SWOT Analysis 166. F. Hoffmann-La Roche AG: Overall Product Portfolio 139. Becton, Dickinson and Company: Revenue (by Region), 2015-2017 167. F. Hoffmann-La Roche AG: Overall Financials, 2015- 2017 140. Becton, Dickinson and Company: R&D Expenditure, 2015-2017 168. F. Hoffmann-La Roche AG: Revenue (by Segment), 2015-2017 141. Becton, Dickinson and Company: Revenue Forecast, 2015-2020 169. F. Hoffmann-La Roche AG: Revenue Split for Diagnostics, 2015-2017 142. Becton, Dickinson and Company: SWOT Analysis 170. F. Hoffmann-La Roche AG: Revenue (by Region), sales@bisresearch.com | www.bisresearch.com
List of Figures 2015-2017 2016-2018 171. F. Hoffmann-La Roche AG: R&D Expenditure, 2015-2017 199. Siemens Healthineers, Inc.: Revenue Forecast, 2015-2020 172. F. Hoffmann-La Roche AG: Revenue Forecast, 2015-2020 200. Siemens Healthineers, Inc.: SWOT Analysis 201. Thermo Fisher Scientific Inc.: Overall Product Portfolio 173. F. Hoffmann-La Roche AG: SWOT Analysis 174. GUARDANT HEALTH, INC: Overall Product Portfolio 202. Thermo Fisher Scientific Inc.: Overall Financials, 2015-2017 175. GUARDANT HEALTH, INC: SWOT Analysis 203. Thermo Fisher Scientific Inc.: Revenue (by Segment), 2015-2017 176. Illumina, Inc.: Overall Product Portfolio 204. Thermo Fisher Scientific Inc.: Revenue (by Region), 2015-2017 177. Illumina, Inc.: Overall Financials, 2015-2017 178. Illumina, Inc.: Revenue (by Segment), 2015-2017 205. Thermo Fisher Scientific Inc.: R&D Expenditure, 2015-2017 179. Illumina, Inc.: Revenue (by Region), 2015-2017 180. Illumina, Inc.: R&D Expenditure, 2015-2017 206. Thermo Fisher Scientific Inc.: Revenue Forecast, 2015-2020 181. Illumina, Inc.: Revenue Forecast, 2015-2020 207. Thermo Fisher Scientific Inc.: SWOT Analysis 182. Illumina, Inc.: SWOT Analysis 208. QuantuMDx Group Ltd.: Overall Product Portfolio (Available from FY2019) 183. Invivoscribe Technologies, Inc.: Overall Product Portfolio 209. HTG Molecular Diagnostics, Inc.: Overall Product Portfolio 184. Invivoscribe Technologies, Inc.: SWOT Analysis 185. MolecularMD Corporation: Overall Product Portfolio 210. Global Molecular Diagnostics Market Segmentation 186. MolecularMD Corporation: SWOT Analysis 211. Global Molecular Diagnostics Market Research Methodology 187. QIAGEN N.V.: Overall Product Portfolio 188. QIAGEN N.V.: Overall Financials, 2015-2017 212. Primary Research 189. QIAGEN N.V.: Revenue (by Segment), 2015-2017 213. Secondary Research 190. QIAGEN N.V.: Revenue (by Region), 2015-2017 214. Data Triangulation 191. QIAGEN N.V.: R&D Expenditure, 2015-2017 215. Bottom-up Approach (Segment-wise Analysis) 192. QIAGEN N.V.: Revenue Forecast, 2015-2020 216. Top-down Approach (Segment-wise Analysis) 193. QIAGEN N.V.: SWOT Analysis 217. Assumptions and Limitations 194. Siemens Healthineers, Inc.: Overall Product Portfolio 218. Considered Factors for Data Prediction and Modeling 195. Siemens Healthineers, Inc.: Overall Financials, 2016-2018 196. Siemens Healthineers, Inc.: Revenue (by Segment), 2016-2018 197. Siemens Healthineers, Inc.: Revenue (by Region), 2016-2018 198. Siemens Healthineers, Inc.: R&D Expenditure, sales@bisresearch.com | www.bisresearch.com
Research Scope & BIS Methodology Key Trends Targeted in the Report What are the emerging trends in the global molecular diagnostics market? How are these trends revolutionizing the diagnostic procedure? Which technologies are anticipated to break-through the current molecular diagnostic regime? Which companies are anticipated to be highly disruptive in the future and why? What are the regulatory procedures that are required to unify the approval process for emerging molecular diagnostics? How will these enhance the reimbursement scenario? What are the gaps in regularizing optimum molecular diagnostic adoption in regular healthcare routines? How are these gaps being tackled? 1. Scope of the Report The report constitutes of an in-depth study of the global molecular diagnostics market, including a thorough analysis of the types of products. The study also presents a detailed analysis of the market dynamics and the estimation of the market size over the forecast period 2018-2028. The scope of this report is focused on the molecular diagnostics products for different applications, for different end-users, and their country-wise analysis. The market value may vary from 5-7% as the data has been collected from different sources at the regional and country level. The market analysis includes an in-depth examination of the key ecosystem players and key strategies and developments taking place in this market. However, the market estimation only includes the molecular diagnostics manufacturers across the globe. Further, it includes the market dynamics (market drivers, challenges, and opportunities) and industry analysis. The purpose of the study is to gain a holistic view of the global molecular diagnostics market in terms of various factors influencing it, including regulatory reforms, and technological advancements. The market has been segmented into ‘products’, ‘applications’, ‘technologies’, ‘end-users’, and ‘regions’. The scope of this report is centered upon conducting a detailed study of the products allied with the molecular diagnostics market. In addition, the study also includes the exhaustive information on the unmet needs, perception on the new products, competitive landscape, market share of leading manufacturers, growth potential of each product, application, region, and company, as well as other vital information with respect to global molecular diagnostics market. Products, for which no real-time data was available in the public domain, personnel from the respective companies were contacted in order to gain valuable information pertaining to the product in different regions and their corresponding prices. This information was then used to estimate the global number for a particular product which was later validated by the industry experts. 2. Market Research Methodology The research methodology design adopted for this specific study includes a mix of data collected from primary and secondary sources. Both primary sources (in-house experts, industry leaders, and market players) and secondary sources (a host of paid and unpaid databases) along with analytical tools have been used exhaustively to build the forecast and predictive models. sales@bisresearch.com | www.bisresearch.com
Research Scope & BIS Methodology Figure 1: Research Methodology Scope Definition Research Design Market Study Qualitative Quantitative Primary Interviews/ Secondary Research Top Down and Bottom Up Primary & Secondary Data Report Writing Data Validation Data Analysis Data Collection Source: BIS Research Analysis. Primary Data Sources The key data points taken from the primary sources include: Validation and triangulation of all the numbers and graphs Validation of report segmentation and key qualitative findings Understanding the competitive landscape Understanding and considering the factors for market dynamics of various market segments and sub-segments Validation of impact analysis of macro and micro factors in different countries Percentage split of individual markets for geographical analysis sales@bisresearch.com | www.bisresearch.com
Research Scope & BIS Methodology Secondary Data Sources The research study involves the usage of extensive secondary sources such as databases, company websites, and annual reports, among others. The following figure exhibits key secondary data sources considered in this report: Figure 2: Secondary Data Sources Stock Analyst Websites Company Sources Seeking Alpha Yahoo Finance Wiki Finance The Wall Street Journal Annual Reports Press Releases Sec Filings Investor Presentations Financial Disclosures SECONDARY DATA SOURCES Government and Regulatory Sources Public and Private Database Centers for Disease Control and Prevention (CDC) The World Health Organization (WHO) The National Health Services (NHS) The National Center for Biotechnology Infromation (NCBI) The Food & Drug Administration of United States (U.S. FDA) Medline PubMed National Library of Medicine ProQuest CMS Database Medicare Beneficiary Database Oxon Epidemiology Source: BIS Research Analysis. The key data points taken from the secondary sources include: Segmentation breakups, split-ups, and percentage shares Data for market value Key industry trends of the top players of the market Qualitative insights into various aspects of the market, key trends, and emerging areas of innovation Quantitative data for mathematical and statistical calculations sales@bisresearch.com | www.bisresearch.com
Research Scope & BIS Methodology Figure 3: Data Triangulation List of Tables The following figure exhibits data triangulation considered in this study: Data Analysis The data collected from Primary and Secondary resources is validated and analyzed to arrive at a market size through a top-down or a bottom- up approach. Bis Research Internal Repository DATA TRIANGULATION Primary Sources Secondary Sources Primary Sources Secondary Sources Qualitative and Quantitative data collected from interviews conducted with senior management personnel from renowned companies and industry experts. Qualitative data collected from reliable resources, white papers, e-magazines, government records, and trade data. Source: BIS Research Analysis. REQUEST FOR SAMPLE sales@bisresearch.com | www.bisresearch.com
BIS Research 39111 Paseo Padre PKWY STE 313, Fremont CA 94538-1686, Tel: +1-510-404-8135 Global Delivery Centre Tapasya Corp Heights, Subarea, Sector 126, Noida, NCR-201303 India Tel: +91 120 4261540 / +91 120 4261544 To know more about us, please visit our website: bisresearch.com For other queries contact: sales@bisresearch.com sales@bisresearch.com | www.bisresearch.com sales@bisresearch.com | www.bisresearch.com


![Molecular Diagnostics Market Size & Share [2018-2023]](https://cdn5.slideserve.com/9788849/molecular-diagnostics-market-worth-15-94-billion-dt.jpg)