Download
1 / 10
110 likes | 122 Views
Over longer distances, it is generally more cost-effective to transport hydrogen in liquid form, because a liquid hydrogen tank can carry considerably more hydrogen than a pressurized gas tank. Liquid hydrogen trailers have a range of about 4,000 km. The tanks are designed to store liquid hydrogen at the correct pressure and temperature. On the other hand, the demand for pipelines network<br>is low in the liquid hydrogen market because pipelines need high levels of initial investment.

E N D
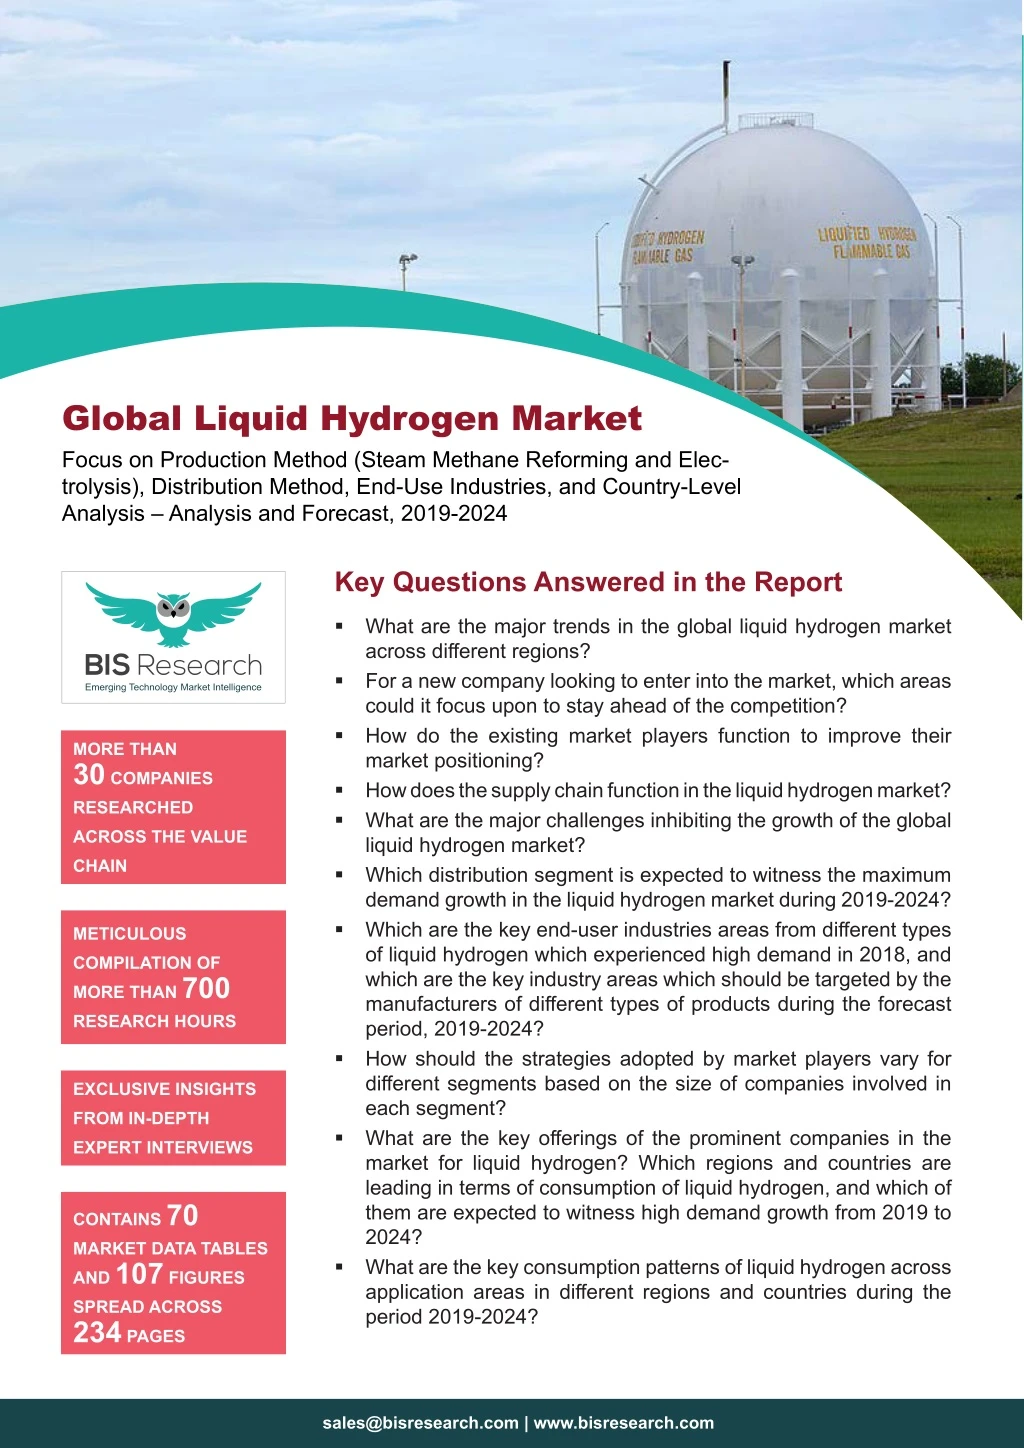
Global Liquid Hydrogen Market Focus on Production Method (Steam Methane Reforming and Elec- trolysis), Distribution Method, End-Use Industries, and Country-Level Analysis – Analysis and Forecast, 2019-2024 Key Questions Answered in the Report What are the major trends in the global liquid hydrogen market across different regions? For a new company looking to enter into the market, which areas could it focus upon to stay ahead of the competition? How do the existing market players function to improve their market positioning? How does the supply chain function in the liquid hydrogen market? What are the major challenges inhibiting the growth of the global liquid hydrogen market? Which distribution segment is expected to witness the maximum demand growth in the liquid hydrogen market during 2019-2024? Which are the key end-user industries areas from different types of liquid hydrogen which experienced high demand in 2018, and which are the key industry areas which should be targeted by the manufacturers of different types of products during the forecast period, 2019-2024? How should the strategies adopted by market players vary for different segments based on the size of companies involved in each segment? What are the key offerings of the prominent companies in the market for liquid hydrogen? Which regions and countries are leading in terms of consumption of liquid hydrogen, and which of them are expected to witness high demand growth from 2019 to 2024? What are the key consumption patterns of liquid hydrogen across application areas in different regions and countries during the period 2019-2024? MORE THAN 30 COMPANIES RESEARCHED ACROSS THE VALUE CHAIN METICULOUS COMPILATION OF MORE THAN 700 RESEARCH HOURS EXCLUSIVE INSIGHTS FROM IN-DEPTH EXPERT INTERVIEWS CONTAINS 70 MARKET DATA TABLES AND 107 FIGURES SPREAD ACROSS 234 PAGES sales@bisresearch.com | www.bisresearch.com
Table of Contents Market Drivers Market Restraints Market Opportunities Market Challenges SCOPE & RESEARCH METHODOLOGY Report Scope Global Liquid Hydrogen Market Research Methodology Key Market Development and Strategies Market Share Analysis COMPANY PROFILES Supply Chain Analysis Cost Analysis Industry Attractiveness Opportunity Matrix Analysis Production Capacity by Company Regulations, Standards, and Codes for Liquid Hydrogen Liquid Hydrogen Manufacturers Profile MARKET DYNAMICS Air Products and Chemicals, Inc. Air Liquide COMPETITIVE LANDSCAPE Elme Messer Gaas AS Iwatani Corporation Kawasaki Heavy Industries, Ltd. Market Overview Transport Pipelines INDUSTRY ANALYSIS Linde plc The Andhra Sugars Limited GLOBAL LIQUID HYDROGEN MARKET (BY DISTRIBUTION METHOD), ANALYSIS AND FORECAST (2019-2024) Market Overview Future Methods for Producing Liquid Hydrogen Steam Methane Reforming (SMR) Electrolysis TAIYO NIPPON SANSO CORPORATION United Hydrogen GLOBAL LIQUID HYDROGEN MARKET (BY PRODUCTION METHOD), ANALYSIS AND FORECAST (2019-2024) Liquid Hydrogen Suppliers Profile Universal Industrial Gases, Inc. Market Overview Transportation Electronics Chemicals and Petrochemicals Refining Metals Glass Others GLOBAL LIQUID HYDROGEN MARKET (BY END-USE INDUSTRY), ANALYSIS AND FORECAST (2019-2024) Wuxi Yuantong Gas Co., Ltd Liquid Hydrogen Customers Profile LIQUID HYDROGEN MARKET (BY REGION), ANALYSIS AND FORECAST (2019-2024) List of Major Customers of Liquid Hydrogen Ballard Power Systems Inc. Market Overview Asia-Pacific North America Europe Rest-of-the-World FuelCell Energy, Inc. FirstElement Fuel, Inc. Hydrogenics VIEW COMPLETE TABLE OF CONTENT sales@bisresearch.com | www.bisresearch.com
List of Tables 1. Impact Analysis of Drivers 2. Energy Content for Various Fuels 3. Gasoline Prices, by Country, 2018 4. Impact Analysis of Restraints 5. Cost of Liquid Hydrogen Transport via Ship 6. Key Business Expansion Activities (2016-2019) 7. Partnerships, Collaborations, and Contracts (2016- 2019) 8. Contracts and Agreements (2016-2019) 9. Mergers, Acquisitions and Joint Ventures (2016- 2019) 10. Product Launches (2016-2019) 11. Key Factors in Determining Threat from New Entrants in Liquid Hydrogen Market 12. Key Factors in Determining Bargaining Power of Suppliers in the Liquid Hydrogen Market 13. Key Factors in Determining Bargaining Power of Buyers in Liquid Hydrogen Market 14. Analyzing the Threat of Substitutes 15. Analyzing the Intensity of Competition 16. Facilities With Production Capacities 17. Summary of Regulations, Standards and Codes 18. International Standards for Liquid Hydrogen 19. Global Liquid Hydrogen Market (by Distribution Method), Tons, 2018-2024 20. Global Liquid Hydrogen Market (by Distribution Method), $Million, 2018-2024 21. Various Methods for Producing Liquid Hydrogen 22. Global Liquid Hydrogen Market (by Production Method), Kilotons, 2018-2024 23. Global Liquid Hydrogen Market (by Production Method), $Million, 2018-2024 24. Global Liquid Hydrogen Market (by End-Use Industry), Kilotons, 2018-2024 25. Global Liquid Hydrogen Market (by End-Use Industry), $Million, 2018-2024 26. Use of Liquid Hydrogen as a Transportation Fuel 27. Orbital Launches, by Vehicle Configuration, 2018 28. National FCEV Targets 29. National Hydrogen Fueling Station Targets 30. Total Forklifts in Use (by Country), 2018 31. Applications for Liquid Hydrogen in Semiconductor Manufacturing 32. Global Liquid hydrogen Market (by Region), Kilotons, 2018-2024 33. Global Liquid Hydrogen Market (by Region), $Million, 2018-2024 34. Asia-Pacific Liquid Hydrogen Market (by Production Method), Kilotons, 2018-2024 35. Asia-Pacific Liquid Hydrogen Market (by Production Method), $Million, 2018-2024 36. Asia-Pacific Liquid Hydrogen Market (by End-Use Industry), Tons, 2018-2024 37. Asia-Pacific Liquid Hydrogen Market (by End-Use Industry), $Million, 2018-2024 38. Recent FCEVs Developments in China 39. China Liquid Hydrogen Market (by End-Use Industry), Tons, 2018-2024 40. China Liquid Hydrogen Market (by End-Use Industry), $Thousand, 2018-2029 41. South Korea Liquid Hydrogen Market (by End-Use Industry), Tons, 2018-2024 42. South Korea Liquid Hydrogen Market (by End-Use Industry), $Thousand, 2018-2024 43. Japan Liquid Hydrogen Market (by End-Use Industry), Tons, 2018-2024 44. Japan Liquid Hydrogen Market (by End-Use Industry), $Thousand, 2018-2024 45. India Liquid Hydrogen Market (by End-Use Industry), Tons, 2018-2024 46. India Liquid Hydrogen Market (by End-Use Industry), $Thousand, 2018-2024 47. Rest-of-Asia-Pacific Liquid Hydrogen Market (by End-Use Industry), Tons, 2018-2024 48. Rest-of-Asia-Pacific Liquid Hydrogen Market (by End-Use Industry), $Thousand, 2018-2024 49. North America Liquid Hydrogen Market (by Production Method), Kilotons, 2018-2024 50. North America Liquid Hydrogen Market (by Production Method), $Million, 2018-2024 51. North America Liquid Hydrogen Market (by End-Use Industry), Tons, 2018-2024 52. North America Liquid Hydrogen Market (by End-Use Industry), $Thousand, 2018-2024 53. U.S. Liquid Hydrogen Market (by End-Use Industry), Tons, 2018-2024 54. U.S. Liquid Hydrogen Market (by End-Use Industry), $Thousand, 2018-2024 55. Canada Liquid Hydrogen Market (by End-Use Industry), Tons, 2018-2024 sales@bisresearch.com | www.bisresearch.com
List of Tables 56. Canada Liquid Hydrogen Market (by End-Use Industry), $Thousand, 2018-2024 57. Mexico Liquid Hydrogen Market (by End-Use Industry), Tons, 2018-2024 58. Mexico Liquid Hydrogen Market (by End-Use Industry), $Thousand, 2018-2024 59. Europe Liquid Hydrogen Market (by Production Method), Kilotons, 2018-2024 60. Europe Liquid Hydrogen Market (by Production Method), $Million, 2018-2024 61. Europe Liquid Hydrogen Market (by End-Use Industry), Tons, 2018-2024 62. Europe Liquid Hydrogen Market (by End-Use Industry), $Thousand, 2018-2024 63. Germany Liquid Hydrogen Market (by End-Use Industry), Tons, 2018-2024 64. Germany Liquid Hydrogen Market (by End-Use Industry), $Thousand, 2018-2024 65. U.K. Liquid Hydrogen Market (by End-Use Industry), Tons, 2018-2024 66. U.K. Liquid Hydrogen Market (by End-Use Industry), $Thousand, 2018-2024 67. France Liquid Hydrogen Market (by End-Use Industry), Tons, 2018-2024 68. France Liquid Hydrogen Market (by End-Use Industry), $Thousand, 2018-2024 69. Rest-of-Europe Liquid Hydrogen Market (by End-Use Industry), Tons, 2018-2024 70. Rest-of-Europe Liquid Hydrogen Market (by End-Use Industry), $Thousand, 2018-2024 sales@bisresearch.com | www.bisresearch.com
List of Figures 1. Global Liquid Hydrogen Market Overview, 2018-2024 2. Global Liquid Hydrogen Market (by Production Method), 2018, 2019, and 2024 3. Global Liquid Hydrogen Market Analysis (by Distribution Method) 4. Global Liquid Hydrogen Market Analysis (by End-Use Industry) 5. Global Liquid Hydrogen Market (by Region), 2018 6. Market Dynamics: Global Liquid Hydrogen Market 7. Role of Liquid Hydrogen in Decarbonizing Major Sectors 8. Global Fuel Price Changes, 2008-2018 9. Share of Key Market Strategies and Developments, 2016-2019 10. Liquid Hydrogen Market Share Analysis, 2018 11. Global Liquid Hydrogen Market Supply Chain 12. Cost Analysis of Liquid Hydrogen Supply Chain 13. Porters Five Forces Analysis of Liquid Hydrogen Market 14. Global Liquid Hydrogen Market Opportunity Matrix (by Region), 2019-2024 15. Distribution Method of Liquid Hydrogen 16. Transport in Global Liquid Hydrogen Market (by Distribution Method), $Million and Kilotons, 2018-2024 17. Pipelines in Global Liquid Hydrogen Market (by Distribution Method), $Million and Kilotons, 2018-2024 18. Global Liquid Hydrogen Market- Production Method of Segmentation 19. Steam Methane Reforming in Global Liquid Hydrogen Market (by Production Method), $Million, 2018-2024 20. Electrolysis in Global Liquid Hydrogen Market (by Production Method), $Million and Kilotons, 2018-2024 21. Global Liquid Hydrogen- End-Use Industry Segmentation 22. Number of Launches, by Country, 2018 23. Transportation Industry in Global Liquid Hydrogen Market (by End-Use Industry), $Million and Kilotons, 2018-2024 24. Electronics Industry in Global Liquid Hydrogen Market (by End-Use Industry), $Million and Kilotons, 2018-2024 25. Chemicals and Petrochemicals Industry in Global Liquid Hydrogen Market (by End-Use Industry), $Million and Kilotons, 2018-2024 26. Refining Industry in Global Liquid Hydrogen Market (by End-Use Industry), $Million and Kilotons, 2018-2024 27. Metals Industry in Global Liquid Hydrogen Market (by End-Use Industry), $Million and Kilotons, 2018-2024 28. Glass Industry in Global Liquid Hydrogen Market (by End-Use Industry), $Million and Kilotons, 2018-2024 29. Others Industry in Global Liquid Hydrogen Market (by End-Use Industry), $Million and Kilotons, 2018-2024 30. Global Liquid Hydrogen Market – Regional Segmentation 31. Global Liquid Hydrogen Market (by Region), Tonnes and $Million, 2018 and 2024 32. China Liquid Hydrogen Market, $Million and Kilotons, 2018-2024 33. South Korea Liquid Hydrogen Market, $Million and Kilotons, 2018-2024 34. Japan Liquid Hydrogen Market, $Million and Kilotons, 2018-2024 35. India Liquid Hydrogen Market, $Million and Kilotons, 2018-2024 36. Rest-of-Asia-Pacific Liquid Hydrogen Market, $Million and Kilotons, 2018-2024 37. U.S. Liquid Hydrogen Market, $Million and Kilotons, 2018-2024 38. Canada Liquid Hydrogen Market, $Million and Kilotons, 2018-2024 39. Mexico Liquid Hydrogen Market, $Million and Kilotons, 2018-2024 40. Germany Liquid Hydrogen Market, $Million and Kilotons, 2018-2024 41. U.K. Liquid Hydrogen Market, $Million and Kilotons, 2018-2024 42. France Liquid Hydrogen Market, $Million and Kilotons, 2018-2024 43. Rest-of-Europe Liquid Hydrogen Market, $Million and Kilotons, 2018-2024 44. Rest-of-the-World Liquid Hydrogen Market, $Million and Kilotons, 2018-2024 45. Air Products and Chemicals, Inc.: Product Portfolio 46. Air Products and Chemicals, Inc.: Overall Financials, 2016-2018 47. Air Products and Chemicals, Inc.: Net Revenue (by Region), 2016-2018 48. Air Products and Chemicals, Inc.: Net Revenue (by Business Segment), 2016-2018 49. Air Products and Chemicals, Inc.: SWOT Analysis 50. Air Liquide: Product Portfolio sales@bisresearch.com | www.bisresearch.com
List of Figures 51. Air Liquide: Overall Financials, 2016-2018 52. Air Liquide: Net Revenue (by Region), 2016-2018 53. Air Liquide: Net Revenue (by Business Segment), 2016-2018 54. Air Liquide: SWOT Analysis 55. Elme Messer Gaas AS: Product Portfolio 56. Elme Messer Gaas AS: SWOT Analysis 57. Iwatani Corporation: Product Portfolio 58. Iwatani Corporation: Overall Financials, 2016-2018 59. Iwatani Corporation: Net Revenue (by Region), 2016-2018 60. Iwatani Corporation: Net Revenue (by Business Segment), 2016-2018 61. Iwatani Corporation: SWOT Analysis 62. Kawasaki Heavy Industries, Ltd.: Product Portfolio 63. Kawasaki Heavy Industries, Ltd.: Overall Financials, 2016-2018 64. Kawasaki Heavy Industries, Ltd.: Net Revenue (by Region), 2016-2018 65. Kawasaki Heavy Industries, Ltd.: Net Revenue (by Business Segment), 2016-2018 66. Kawasaki Heavy Industries, Ltd.: SWOT Analysis 67. Linde plc: Product Portfolio 68. Linde plc: Overall Financials, 2016-2018 69. Linde plc: Net Revenue (by Region), 2016-2018 70. Linde plc: Net Revenue (by Business Segment), 2016-2018 71. Linde plc: SWOT Analysis 72. The Andhra Sugars Limited: Product Portfolio 73. The Andhra Sugars Limited: Overall Financials, 2016-2018 74. The Andhra Sugars Limited: Net Revenue (by Business Segment), 2016-2018 75. The Andhra Sugars Limited: SWOT Analysis 76. TAIYO NIPPON SANSO CORPORATION: Product Portfolio 77. TAIYO NIPPON SANSO CORPORATION: Overall Financials, 2016-2018 78. TAIYO NIPPON SANSO CORPORATION: Net Revenue (by Region), 2016-2018 79. TAIYO NIPPON SANSO CORPORATION: Net Revenue (by Business Segment), 2016-2018 80. TAIYO NIPPON SANSO CORPORATION: SWOT Analysis 81. United Hydrogen: Product Portfolio 82. United Hydrogen: SWOT Analysis 83. Universal Industrial Gases, Inc.: Product Portfolio 84. Universal Industrial Gases, Inc.: SWOT Analysis 85. Wuxi Yuantong Gas Co., Ltd.: Product Portfolio 86. Wuxi Yuantong Gas Co., Ltd.: SWOT Analysis 87. Ballard Power Systems Inc.: Product Portfolio 88. Ballard Power Systems Inc.: Overall Financials, 2016-2018 89. Ballard Power Systems Inc.: Net Revenue (by Region), 2017-2018 90. Ballard Power Systems Inc.: SWOT Analysis 91. FuelCell Energy, Inc.: Product Portfolio 92. FuelCell Energy, Inc.: Overall Financials, 2016-2018 93. FuelCell Energy, Inc.: Net Revenue (by Region), 2017-2018 94. FuelCell Energy, Inc.: SWOT Analysis 95. FirstElement Fuel, Inc.: Product Portfolio 96. FirstElement Fuel, Inc.: SWOT Analysis 97. Hydrogenics: Product Portfolio 98. Hydrogenics: Overall Financials, 2016-2018 99. Hydrogenics: Net Revenue (by Region), 2017-2018 100. Hydrogenics: Net Revenue (by Business Segment), 2016-2018 101. Hydrogenics: SWOT Analysis 102. Global Liquid Hydrogen Market Coverage 103. Segmentations for Market Estimation in the Global Liquid hydrogen Market 104. Report Design 105. Primary Interviews (by Player, Designation, and Region) 106. Data Triangulation 107. Top-Down and Bottom-Up Approach sales@bisresearch.com | www.bisresearch.com
Research Scope & BIS Methodology 1. Scope of the Report The report is a thorough study of the liquid hydrogen market share and market size, including the analysis of different production method, distribution method, and end-use industry of the global liquid hydrogen market. The market trends across the regions have also been extensively analyzed in the liquid hydrogen market study. Further, the market estimated in different sections of the report considered “2019-2024” as the forecast period. 2. BIS Research Market Research Methodology The research methodology design adopted for this specific study includes a mix of data collected from primary and secondary sources. The research exhaustively uses both primary sources (in-house experts, industry leaders and market players) and secondary sources (a host of paid and unpaid databases) along with analytical tools to build forecast and predictive models. Figure 1: Research Methodology List of Tables Scope Definition Research Design Market Study Qualitative Quantitative Primary Interviews/ Secondary Research Top Down and Bottom Up Primary & Secondary Data Report Writing Data Validation Data Analysis Data Collection sales@bisresearch.com | www.bisresearch.com
Research Scope & BIS Methodology Primary Data Sources The primary sources involve the industry experts from the global liquid hydrogen market. In the extensive primary research process undertaken for this study, the primary sources include industry experts and key executives from prominent companies, research organizations and energy management associations. All such resources have been interviewed to obtain and verify both the qualitative and the quantitative aspects of this research study.The key data points taken from primary sources include: The key data points taken from primary sources include: Validation and triangulation of all the numbers and graphs Validation of report’s segment and key qualitative findings Understanding the competitive landscape Validation of several market segments for the liquid hydrogen market Percentage split for countries The research includes interviews with participants throughout the value chain. An extensive questionnaire was shared to get insights from the experts who didn’t participate in discussions. In some cases where information was not available, Delphi method was used to arrive at mutual consent with BIS consultants. Secondary Data Sources The process of market engineering involves calculation of the market statistics, market size estimation, market forecast, market crackdown, and data triangulation (the methodology for these quantitative data processes is explained in the further sections). An extensive primary research study was undertaken to gather information, and authenticate the critical numbers arrived through segmentation types, industry trends, and key players in the market. sales@bisresearch.com | www.bisresearch.com
Research Scope & BIS Methodology Figure 2: Data Triangulation The following figure exhibits data triangulation considered: BIS Research Internal Repository Key Players Competitive Landscape Opportunities/Challenges Market Size and Market Share Influencing Factors Market Estimates Regional Analysis Bis Research Internal Repository DATA TRIANGULATION Primary Sources Secondary Sources Primary Sources Secondary Sources Demand Side Aerospace Industry Automotive Manufactures Semiconductor Device Manufacturers Metals Manufactures Glass Manufacturers Aviation industry Fuel Cell Vehicle Manufacturers Supply Side Hydrogen Manufacturers Hydrogen Refueling Stations Manufacturers Liquid Hydrogen Manufacturers Demand Side Industry Associations IEA Hydrogen NREL ICCT EIA EIGA Hydrogen. Energy Hysag World Nuclear Associations Annual Reports of Key Industrial Players SEC Filings 10K Reports Investor Presentations Analyst Presentations Journals Press Releases Paid & Unpaid Databases Hydrogen Council REQUEST FOR SAMPLE sales@bisresearch.com | www.bisresearch.com
BIS Research 39111 Paseo Padre PKWY STE 313, Fremont CA 94538-1686, Tel: +1-510-404-8135 Global Delivery Centre Tapasya Corp Heights, Subarea, Sector 126, Noida, NCR-201303 India Tel: +91 120 4261540 / +91 120 4261544 To know more about us, please visit our website: bisresearch.com For other queries contact: sales@bisresearch.com sales@bisresearch.com | www.bisresearch.com sales@bisresearch.com | www.bisresearch.com