Download
1 / 16
160 likes | 225 Views
The lightweight metals cater to the impending demand of a number of application verticals which is the major reason behind their biggest market share.

E N D
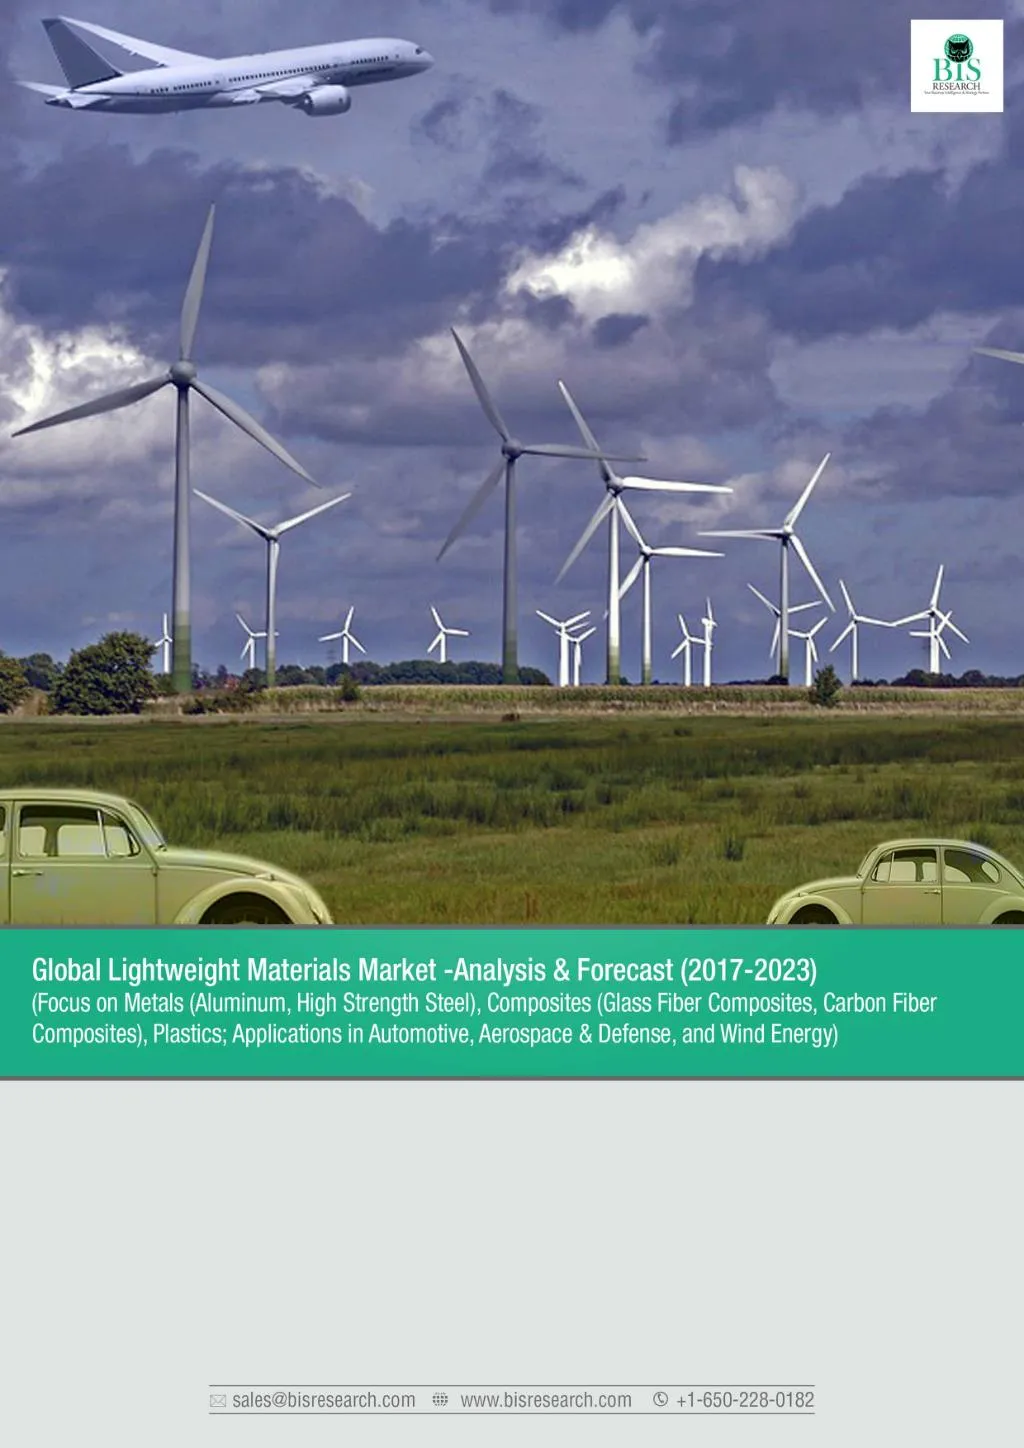
Global Lightweight Materials Market Analysis and Forecast, 2017-2023 The global lightweight materials market in terms of value is estimated to witness a growth at a CAGR of 7.0% between 2017 and 2023. The increasing demand and the growth rate for lightweight materials in the market is attributed to their increasing usage in end-use industries such as automotive, aerospace & defense, wind energy and others. The rising demand is in line with the unique properties of lightweight materials. The properties such as low density, high strength and stiffness, high ductility, temperature and corrosion resistance make lightweight materials a preferred choice over conventional materials such as iron and steel. These properties help in weight reduction, leading to increased fuel economy, reduced CO2 emissions and longer life and low maintenance costs. The report is a compilation of various segmentations including market breakdown by lightweight material type, sub-type, end-use applications, and different geographical regions. It also includes sections on competitive insights and market dynamics. Herein, the revenue generated from lightweight materials is tracked to calculate the market size. While highlighting the key driving and restraining forces for this market, the report provides a comprehensive section of the application areas of the lightweight materials market. It also examines the role of the leading market players involved in this market. The report addresses the following key questions about the global lightweight materials market: • What is the global lightweight materials market size in terms of revenue from 2016- 2023? • Which is the dominant type and sub-type by revenue in the lightweight materials market? • What is the revenue generated by the different lightweight materials by type and sub- type in the lightweight materials market? • What is the revenue generated in the different applications of the lightweight materials market? • What are the different factors driving the market in the forecast period? • What are the major factors challenging the growth of global lightweight materials market? • What are opportunities for the global lightweight materials market? • What kind of new strategies are being adopted by existing market players to make a mark in the industry? • What is the revenue generated by the different geographic regions in the lightweight materials market? • Which region will lead to the global lightweight materials market by the end of the forecast period? • Which are the existing key market players that have made a mark in the lightweight materials market? The report has put special emphasis on the market share and size of metals, composites and www.bisresearch.com
Global Lightweight Materials Market Analysis and Forecast, 2017-2023 plastics, owing to their high share in the current and upcoming market of lightweight materials. The industry analysis have also been undertaken in order to examine the impact of various factors and understand the overall attractiveness of the industry. The most often used strategy for developing a better hold on to the market has been through agreements, collaborations, contracts, and partnerships, followed by new product launches. The company profile section includes highlights of significant information about the key companies involved, along with their financial summaries and key strategies & developmental activities of recent years. Some of the key players involved in this market are Toray Industries Inc., Teijin Limited, Mitsubishi Rayon Co. Ltd., SGL Group, Hexcel Corporation, Cytec Industries, Owens Corning Corporation, Jushi Group Co. Ltd, Dead Sea Magnesium Ltd., Titanium Metals Corporation, Vsmpo-Avisma Corporation, ALCOA Inc., Novelis Inc., Arcelor Mittal S.A., Rio Tinto, China Hongqiao Group, Thyssenkrup AG, Lyondellbasell Industries N.V., Formosa Plastic, and SABIC. Metals dominated the lightweight materials market accounting for a market share of 60% by value in 2016. Asia Pacific generated the maximum amount of revenue in the year 2016 in the global lightweight materials market followed by North America and Europe. Additionally, APAC has the highest potential to grow in the forecast period due to the presence of emerging economies such as China and India. Global Lightweight Materials Market Global Lightweight Materials Market: US$ Billion Global Lightweight Materials Market: Million Tons Leading Players Alcoa Inc. Arcelor Mittal S.A. XX China Hongqiao Group XX Formosa Plastics Corporation CAGR XX% Mitsubishi Rayon Co. Ltd. CAGR XX% Novelis Inc. XX XX Jushi Fiber Glass Co. Ltd. XX XX Owens Corning Corporation Rio Tinto Group SGL Group Toray Industries Inc. Trinseo S.A. 2016 2017 2023 2016 2017 2023 Secondary research, expert interviews, and BIS Research Analysis www.bisresearch.com
Global Lightweight Materials Market Analysis and Forecast, 2017-2023 CURRENT MARKET INFORMATION INFLUENCING FACTORS COMPETITOR ANALYSIS REGIONAL ANALYSIS MARKET SIZE SUPPLY CHAIN ANALYSIS GOVERNMENT REGULATIONS MARKET SHARE COMPANY DEVELOPMENTS COMPETITIVE LANDSCAPE PLAYER SHARE ANALYSIS RESEARCH & DEVELOPMENT ANALYSIS MARKET RESTRAINTS MARKET DRIVERS AGREEMENTS, CONTRACTS COLLABORATIONS, JOINT VENTURES, & PARTNERSHIPS: More than 50 deals in the last FOUR years MARKET OPPORTUNITIES MARKET CHALLENGES INDUSTRY TRENDS GEOGRAPHIC USAGE PATTERN PARAMETERS FOR MARKET ESTIMATION By Material Type By Region By Application Automotive Aerospace & Defense Wind Energy Others Composites North America Europe Asia-Pacific Middle East & Africa South America Metals o Carbon fibers o Glass fibers o Aluminum o High Strength Steel Plastics www.bisresearch.com
Global Lightweight Materials Market Analysis and Forecast, 2017-2023 TABLE OF CONTENTS 3.4 R & D Analysis of Key Market Players 3.5 Key Strategies and Developments 3.5.1 Agreements, Collaborations, Contracts, Joint Venture, & Partnerships 3.5.2 Business Expansions 3.5.3 New Product Launches & Developments 3.5.4 Mergers & Acquisitions 3.5.5 Others 4 Industry Analysis 4.1 Supply Chain Analysis 4.2 Porter’s Five Forces Analysis 4.2.1 Threat of New Entrants 4.2.2 Threat of Substitutes 4.2.3 Bargaining Power of Buyers 4.2.4 Bargaining Power of Suppliers 4.2.5 Intensity of Competitive Rivalry 4.3 Future Trends and Developments in Lightweight materials Market 5 Global Lightweight Materials Market, by Type 5.1 Assumptions for Analysis and Forecast of the Global Lightweight Materials Market 5.2 Introduction 5.2.1 Metals 5.2.1.1 Lightweight Metals Market, by Sub-Type 5.2.1.1.1 Aluminium 5.2.1.1.2 High Strength Steel 5.2.1.1.3 Magnesium 5.2.1.1.4 Titanium 5.2.1.1.5 Beryllium 5.2.1.2 Lightweight Metals Market, by Application 5.2.1.3 Lightweight Metals Market, by Region 5.2.2 Composites 5.2.2.1 Lightweight Composites Market, by Sub-Type 5.2.2.1.1 Glass Fibers 5.2.2.1.2 Carbon Fibers 5.2.2.2 Lightweight Composites Market, by Application 5.2.2.3 Lightweight Composites Market, by Region Executive Summary 1 Research Scope and Methodology 1.1 Report Scope 1.2 Global Lightweight Materials Market Research Methodology 1.2.1 Assumptions and Limitations 1.2.2 Primary Research 1.2.3 Secondary Research 1.2.4 Data Triangulation 1.2.5 Data Analysing & Market Estimation 2 Market Dynamics 2.1 Introduction 2.2 Market Drivers 2.2.1 Superior Properties 2.2.2 Stringent Regulations 2.2.3 Increasing Material Innovation and Demand in the End-Use Industries 2.3 Market Restraints 2.3.1 High Cost of Lightweight Materials and Technological Advancements 2.3.2 Uncertainty in Production Tax Credit (PTC) 2.4 Market Opportunities 2.4.1 Growing Demand of Composites in New Lightweight Applications 2.4.2 Rapid Growth in Wind Energy Installations 2.4.3 Growing demand in Emerging Economies 3 Competitive Insights 3.1 Player Share Analysis 3.1.1 Product Segment Share, by Company, 2016 & 2017 3.1.1.1 Carbon Fiber Composites Market Share, 2016 3.1.1.2 Carbon Fiber Composites Market Share, 2017-Estimated 3.1.1.3 Glass Fiber Composites Market Share, 2016 3.1.1.4 Glass Fiber Composites Market Share, 2017-Estimated 3.1.1.5 Aluminum Competitive Analysis, 2016 3.2 Opportunity Matrix Analysis 3.3 Country Share Analysis www.bisresearch.com
Global Lightweight Materials Market Analysis and Forecast, 2017-2023 TABLE OF CONTENTS 7.1.2.4.1 Lightweight Materials Market, by Type 7.1.2.5 Mexico 7.1.2.5.1 Lightweight Materials Market, by Type 7.1.3 Europe 7.1.3.1 Lightweight Materials Market, by Type 7.1.3.2 Lightweight Materials Market, by Country 7.1.3.3 Germany 7.1.3.3.1 Lightweight Materials Market, by Type 7.1.3.4 The United Kingdom 7.1.3.4.1 Lightweight Materials Market, by Type 7.1.3.5 France 7.1.3.5.1 Lightweight Materials Market, by Type 7.1.3.6 Italy 7.1.3.6.1 Lightweight Materials Market, by Type 7.1.3.7 Rest of Europe 7.1.3.7.1 Lightweight Materials Market, by Type 7.1.4 Middle East & Africa 7.1.4.1 Lightweight Materials Market, by Type 7.1.5 South America 7.1.5.1 Lightweight Materials Market, by Type 8 Company Profiles 8.1 Introduction 8.2 Alcoa Corporation 8.2.1 Company Overview 8.2.2 Financials 8.2.3 Financial Summary 8.2.4 SWOT Analysis 8.3 Arcelor Mittal S.A. 8.3.1 Company Overview 8.3.2 Product Portfolio 8.3.3 Financials 8.3.3.1 Financial Summary 8.3.4 SWOT Analysis 8.4 Bayer A.G. 5.2.3 Plastics 5.2.3.1 Lightweight Plastics Market, by Application 5.2.3.2 Lightweight Plastics Market, by Region 6 Global Lightweight Materials Market, by End-Use Industry 6.1.1 Automotive 6.1.1.1 Powertrain 6.1.1.2 Structural 6.1.1.3 Interior 6.1.1.4 Exterior 6.1.2 Aerospace & Defense 6.1.3 Wind Energy 6.1.4 Others 7 Global Lightweight Materials Market, by Region 7.1 Introduction 7.1.1 Asia-Pacific 7.1.1.1 Lightweight Materials Market, by Type 7.1.1.2 Lightweight Materials Market, by Country 7.1.1.3 China 7.1.1.3.1 Lightweight Materials Market, by Type 7.1.1.4 Japan 7.1.1.4.1 Lightweight Materials Market, by Type 7.1.1.5 South Korea 7.1.1.5.1 Lightweight Materials Market, by Type 7.1.1.6 India 7.1.1.6.1 Lightweight Materials Market, by Type 7.1.1.7 Rest of Asia-Pacific 7.1.1.7.1 Lightweight Materials Market, by Type 7.1.2 North America 7.1.2.1 Lightweight Materials Market, by Type 7.1.2.2 Lightweight Materials Market, by Country 7.1.2.3 The United States 7.1.2.3.1 Lightweight Materials Market, by Type 7.1.2.4 Canada www.bisresearch.com
Global Lightweight Materials Market Analysis and Forecast, 2017-2023 TABLE OF CONTENTS 8.13 Mitsubishi Rayon Co. Ltd. 8.13.1 Company Overview 8.13.2 Product Portfolio 8.13.3 Financials 8.13.3.1 Financial Summary 8.13.4 SWOT Analysis 8.14 Novelis Inc. 8.14.1 Company Overview 8.14.2 Financials 8.14.2.1 Financial Summary 8.14.3 SWOT Analysis 8.15 Owens Corning Corporation 8.15.1 Company Overview 8.15.2 Product Portfolio 8.15.3 Financials 8.15.3.1 Financial Summary 8.15.4 SWOT Analysis 8.16 PPG Industries Inc. 8.16.1 Company Overview 8.16.2 Product Portfolio 8.16.3 Financials 8.16.3.1 Financial Summary 8.16.4 SWOT Analysis 8.17 Rio Tinto Group 8.17.1 Company Overview 8.17.2 Product Portfolio 8.17.3 Financials 8.17.3.1 Financial Summary 8.17.4 SWOT Analysis 8.18 Saudi Basic Industries Corporation 8.18.1 Company Overview 8.18.2 Product Portfolio 8.18.3 Financials 8.18.3.1 Financial Summary 8.18.4 SWOT Analysis 8.19 Sekisui Jushi Corporation 8.19.1 Company Overview 8.19.2 Product Portfolio 8.19.3 Financials 8.19.3.1 Financial Summary 8.19.4 SWOT Analysis 8.12.3 SWOT Analysis 8.12.2.1 Financial Summary 8.5 China Hongqiao Group Limited 8.5.1 Company Overview 8.5.2 Financials 8.5.2.1 Financial Summary 8.5.3 SWOT Analysis 8.6 Cytec Solvay Group 8.6.1 Company Overview 8.6.2 Financials 8.6.2.1 Financial Summary 8.6.3 SWOT Analysis 8.7 Dead Sea Magnesium Ltd. 8.7.1 Company Overview 8.7.2 About the Company 8.8 Exxon Mobil Corporation 8.8.1 Company Overview 8.8.2 Financials 8.8.2.1 Financial Summary 8.8.3 SWOT Analysis 8.9 E. I. Du Pont de Nemours and Company 8.9.1 Company Overview 8.9.2 Product Portfolio 8.9.3 Financials 8.9.3.1 Financial Summary 8.9.4 SWOT Analysis 8.10 Formosa Plastic Corporation 8.10.1 Company Overview 8.10.2 Product Portfolio 8.10.3 Financials 8.10.3.1 Financial Summary 8.10.4 SWOT Analysis 8.11 Hexcel Corporation 8.11.1 Company Overview 8.11.2 Product Portfolio 8.11.3 Financials 8.11.3.1 Financial Summary 8.11.4 SWOT Analysis 8.12 LyondellBasell Industries N.V. 8.12.1 Company Overview 8.12.2 Financials 8.4.1 Company Overview 8.4.2 Financials 8.4.2.1 Financial Summary 8.4.3 SWOT Analysis www.bisresearch.com
Global Lightweight Materials Market Analysis and Forecast, 2017-2023 TABLE OF CONTENTS or Aviation Special Materials (VSMPO- AVISMA) CORPORATION 8.28.1 Company Overview 8.28.2 Financials 8.28.2.1 Financial Summary 8.28.3 SWOT Analysis 8.20 SGL Group 8.20.1 Company Overview 8.20.2 Product Portfolio 8.20.3 Financials 8.20.3.1 Financial Summary 8.20.4 SWOT Analysis 8.21 Teijin Limited 8.21.1 Company Overview 8.21.2 Product Portfolio 8.21.3 Financials 8.21.3.1 Financial Summary 8.21.4 SWOT Analysis 8.22 ThyssenKrupp A.G. 8.22.1 Company Overview 8.22.2 Product Portfolio 8.22.3 Financials 8.22.3.1 Financial Summary 8.22.4 SWOT Analysis 8.23 Titanium Metals Corporation 8.23.1 Company Overview 8.23.2 About the Company 8.24 Toray Industries Inc. 8.24.1 Company Overview 8.24.2 Product Portfolio 8.24.3 Financials 8.24.3.1 Financial Summary 8.24.4 SWOT Analysis 8.25 Trinseo S.A. 8.25.1 Company Overview 8.25.2 FINANCIALS 8.25.2.1 Financial Summary 8.25.3 SWOT Analysis 8.26 U.S. Magnesium LLC 8.26.1 Company Overview 8.26.2 About the Company 8.27 United States Steel Corporation 8.27.1 Company Overview 8.27.2 Financials 8.27.2.1 Financial Summary 8.27.3 SWOT Analysis 8.28 VerkhneSaldinskoye Metallurgicheskoye Proizvodstvennoye Ob’yedineniye- AVIatsionnyye Spetsial’nyye MAterialy www.bisresearch.com
Global Lightweight Materials Market Analysis and Forecast, 2017-2023 LIST OF TABLE Table 5.13: Composites Lightweight Materials Market, by Application, Million Tons (2016 – 2023) Table 5.13: Composites Lightweight Materials Market, by Application, $Billion (2016 – 2023) Table 5.14: Composites Lightweight Materials Market, by Region, Million Tons (2016 – 2023) Table 5.15: Composites Lightweight Materials Market, by Region, $Billionn(2016 – 2023) Table 5.16: Different Types of Plastics in Lightweight Materials Market Table 5.17: Plastics Lightweight Materials Market, by Application, Million Tons (2016 – 2023) Table 5.18: Plastics Lightweight Materials Market, by Application, $Billion (2016 – 2023) Table 5.19: Plastics Lightweight Materials Market, by Region, Million Tons (2016 – 2023) Table 5.20: Plastics Lightweight Materials Market, by Region, $Billion (2016 – 2023) Table 6.1: Application Overview of Lightweight Materials, by End-Use Industry Table 6.2: Global Lightweight Materials Market, by Application, Million tons (2016 – 2023) Table 6.3: Global Lightweight Materials Market, by Application, $Billion (2016 – 2023) Table 6.4: Automotive Lightweight Materials Market, by Type, Million tons (2016 – 2023) Table 6.5: Automotive Lightweight Materials Market, by Type, $Billion (2016 – 2023) Table 6.6: Some of the Major Players involved in Manufacturing Composite based Automotive Parts Table 6.7: Volume of carbon Fiber used in the Aircraft Table 6.8: Aerospace & Defense Lightweight Materials Market, by Type, Million Table 1: Market Snapshot: Global Lightweight Materials Market Table 2.1: Overview of the Lightweight Materials and their Applications Table 3.1: Aluminium Competitive Analysis, by Production Capacity, 2016 Table 3.2: Agreements, Contracts, Collaborations, Joint Ventures, & Partnerships Table 3.3: Key Business Expansion Activities Table 3.4: Key Product Launches Table 3.5: Key Mergers & Acquisitions Table 3.6: Other Developments Table 4.1: Comparison between Lightweight Materials w.r.t. Mild Steel Table 5.1: Comparison of Lightweight Materials with Steel Table 5.2: Global Lightweight materials Market, by Type, Million tons (2016 – 2023) Table 5.3: Global Lightweight Materials Market, by Type, $Billion (2016 – 2023) Table 5.4: Global Lightweight Metals Market, by Sub-Type, Million Tons (2016 – 2023) Table 5.5: Global Lightweight Metals Market, by Sub-Type, $Billion (2016 – 2023) Table 5.6: Different Types of Aluminum Alloys used in the Aircraft Manufacturing Table 5.6: Metals Lightweight Materials Market, by Application, Million Tons (2016 – 2023) Table 5.7: Metals Lightweight Materials Market, by Application (by value), $Billion (2016 – 2023) Table 5.8: Metals Lightweight Materials Market, by Region, Million tons (2016 – 2023) Table 5.9: Metals Lightweight Materials Market, by Region, $Billion (2016 – 2023) Table 5.10: Composites Lightweight Materials Market, by Sub-Type, Million Tons (2016 – 2023) Table 5.11: Composites Lightweight Materials Market, by Sub-Type, $Billion (2016 – 2023) Table 5.12: Different Kind of Modulus of Carbon Fiber (2016 – 2023) www.bisresearch.com
Global Lightweight Materials Market Analysis and Forecast, 2017-2023 LIST OF TABLE Table 7.11: South Korea: Lightweight Materials Market, by Type, Million Tons (2016 – 2023) Table 7.12: South Korea: Lightweight Materials Market, by Type, $Billion (2016 – 2023) Table 7.13: India: Lightweight Materials Market, by Type, Million Tons (2016 – 2023) Table 7.14: India: Lightweight Materials Market, by Type, $Billion (2016 – 2023) Table 7.15: Rest of Asia-Pacific: Lightweight Materials Market, by Type, Million Tons (2016 – 2023) Table 7.16: Rest of Asia-Pacific: Lightweight Materials Market, by Type, $Billion (2016 – 2023) Table 7.17: North America Lightweight Materials Market, by Type, Million Tons (2016 – 2023) Table 7.18: North America Lightweight Materials Market, by Type, $Billion (2016 – 2023) Table 7.19: North America Lightweight Materials Market by Country, Million Tons (2016 – 2023) Table 7.20: North America Lightweight Materials Market by Country, $Billion (2016 – 2023) Table 7.21: U.S. Lightweight Materials Market, by Type, Million Tons (2016 – 2023) Table 7.22: U.S. Lightweight Materials Market, by Type, $Billion (2016 – 2023) Table 7.23: Canada Lightweight Materials Market, by Type, Million Tons (2016 – 2023) Table 7.24: Canada: Lightweight Materials Market, by Type, $Billion (2016 – 2023) Table 7.25: Mexico Lightweight Materials Market, by Type, Million Tons (2016 – 2023) Table 7.26: Mexico Lightweight Materials Market, by Type, $Billion (2016 – 2023) Table 7.27: Europe Lightweight Materials Market, by Type, Million Tons (2016 – 2023) tons (2016 – 2023) Table 6.9: Aerospace & Defense Lightweight Materials Market, by Type, $Billion (2016 – 2023) Table 6.10: Lightweight Materials used by the Wind Turbine Manufacturers Table 6.11: Cumulative Wind Energy Installations/Wind Power capacity, MW 2011-2016 Table 6.12: Wind Energy Lightweight Materials Market, by Type, Million tons (2016 – 2023) Table 6.13: Wind Energy Lightweight Materials Market, by Type, $Billion (2016 – 2023) Table 6.14: Others Lightweight Materials Market, by type, Million tons (2016 – 2023) Table 6.15: Other Lightweight Materials Market, by Type, $Billion (2016 – 2023) Table 7.1: Global Lightweight Materials Market by Region, by Volume, Million Tons (2016 – 2023) Table 7.2: Global Lightweight Materials Market by Region, by Value, $Billion (2016 – 2023) Table 7.3: Asia-Pacific Lightweight Materials Market, by Type, Million Tons (2016 – 2023) Table 7.4: Asia-Pacific Lightweight Materials Market, by Type, $Billion (2016 – 2023) Table 7.5: Asia-Pacific Lightweight Materials Market by Country, Million Tons (2016 – 2023) Table 7.6: Asia-Pacific Lightweight Materials Market by Country, $Billion (2016 – 2023) Table 7.7: China: Lightweight Materials Market, by Type, Million Tons (2016 – 2023) Table 7.8: China: Lightweight Materials Market, by Type, $Billion (2016 – 2023) Table 7.9: Japan: Lightweight Materials Market, by Type, Million Tons (2016 – 2023) Table 7.10: Japan: Lightweight Materials Market, by Type, $Billion (2016 – 2023) www.bisresearch.com
Global Lightweight Materials Market Analysis and Forecast, 2017-2023 LIST OF TABLE Table 7.28: Europe Lightweight Materials Market, by Type, $Billion (2016 – 2023) Table 7.29: Europe Lightweight Materials Market by Country, Million Tons (2016 – 2023) Table 7.30: Europe Lightweight Materials Market by Country, $Billion (2016 – 2023) Table 7.31: Germany: Lightweight Materials Market, by Type, Million Tons (2016 – 2023) Table 7.32: Germany: Lightweight Materials Market, by Type, $Billion (2016 – 2023) Table 7.33: UK: Lightweight Materials Market, by Type, Million Tons (2016 – 2023) Table 7.34: UK: Lightweight Materials Market, by Type, $Billion (2016 – 2023) Table 7.35: France: Lightweight Materials Market, by Type, Million Tons (2016 – 2023) Table 7.36: France: Lightweight Materials Market, by Type, $Billion (2016 – 2023) Table 7.37: Italy: Lightweight Materials Market, by Type, Million Tons (2016 – 2023) Table 7.38: Italy: Lightweight Materials Market, by Type, $Billion (2016 – 2023) Table 7.39: ROE: Lightweight Materials Market, by Type, Million Tons (2016 – 2023) Table 7.40: ROE: Lightweight Materials Market, by Type, $Billion (2016 – 2023) Table 7.41: ME&A Lightweight Materials Market, by Type, Million Tons (2016 – 2023) Table 7.42: ME&A Lightweight Materials Market, by Type, $Billion (2016 – 2023) Table 7.43: South America Lightweight Materials Market, by Type, Million Tons (2016 – 2023) Table 7.44: South America Lightweight Materials Market, by Type, $Billion (2016 – 2023) www.bisresearch.com
Global Quantum Dots Market, Analysis and Forecast: 2017-2022;Global Lightweight Materials MarketAnalysis and Forecast, 2017-2023 LIST OF FIGURES Capacity, 2016 Figure 1: Lightweight Materials Market Snapshot Figure 2: Lightweight Materials Market Share, by Type, $Billion, 2017 and 2023 Figure 3: Market Attractiveness, by Sub Type, 2017 and 2023 Figure 4: Lightweight Materials Market Size, by Application Figure 5: Lightweight Materials Market, by Region, 2017 and 2023 Figure 6: Lightweight Materials Market, by Country, 2017 Figure 1.1: Global Lightweight Materials Market Scope Figure 1.2: Report Design Figure 1.3: Primary Interviews Breakdown, by Player, Designation, and Region Figure 1.4: Sources of Secondary Research Figure 1.5: Data Triangulation Figure 1.6: Top Down & Bottom Up Approach Figure 2.1: Global Lightweight Materials Market Dynamics Figure 2.2: Comparison between Prices and Specific Strength of Different Materials Figure 2.3: Worldwide Political Initiatives to Reduce CO2 Emissions Figure 2.4: Toray Industries Contribution to CO2 Figure 2.5: Evolution of Raw Materials in Aerospace & Defense Industry Figure 2.6: Evolution of Raw Materials in Automotive Industry Figure 2.7: Impact of PTC Expiration and Extension on U.S. Annual Installed Wind Capacity Figure 2.8: Global Wind Energy Capacity Market Share, By Region, 2016 Figure 3.1: Carbon Fiber Composites Market Share Analysis, by Production Capacity, 2016 Figure 3.2: Carbon Fiber Composites Market Share Analysis, by Production Capacity, 2017-E Figure 3.3: Glass Fiber Composites Market Share Analysis, by Production Figure 3.4: Glass Fiber Composites Market Share Analysis, by Production Capacity, 2017-E Figure 3.5: Global Lightweight Materials Market Opportunity Matrix, by Region, 2016 Figure 3.6: Global Lightweight Materials Market Opportunity Matrix, by Country, 2016 Figure 3.7: Global Lightweight Materials Market Opportunity Matrix, by Country, 2023 Figure 3.8: Country Share Analysis of Global Lightweight Materials Market, 2016 Figure 3.9: R&D Analysis of Key Players in Global Lightweight Materials Market Figure 3.10: Share of Key Market Strategies & Developments Figure 3.11: Total Number of Strategies & Developments Figure 4.1: Global Lightweight Materials Supply Chain Figure 4.2: Global Lightweight Materials Porter’s Five Forces Analysis Figure 5.1: Global Lightweight Materials Market, By Type Figure 5.2: Global Lightweight materials Market Size, by Type, $Billion, 2017 and 2023 Figure 5.3: Metals Lightweight Market Size, $Billion (2016 – 2023) Figure 5.4: Metals Lightweight Market Share, by Sub-Type, Million Tons and $Billion(2016 – 2023) Figure 5.5: Metals Lightweight Materials Market, by Application, $Billion (2017 – 2023) Figure 5.6: Metals Lightweight Materials Market, by Region, Million tons (2017 – 2023) Figure 5.7: Composites Lightweight Market Size, $Billion (2016 – 2023) Figure 5.8: Composites Lightweight Materials Market, by Sub-Type, Million Tons and $Billion (2016 – 2023) Figure 5.9: Strategic Alliances in Automotive Industry, by OEMs and Carbon Fiber www.bisresearch.com
Global Lightweight Materials Market Analysis and Forecast, 2017-2023 LIST OF FIGURES Figure 7.1: Lightweight materials Market Growth Rate, by Region, 2017 and 2023 Figure 7.2: Lightweight materials Market Growth Rate, by Region, 2017 - 2023 Figure 7.3: Asia-Pacific Lightweight Materials Market, by Type, $Billion, 2017- 2023 Figure 7.4: Asia-Pacific Lightweight Materials Market, by Country, $Billion, 2017- 2023 Figure 7.5: North America Lightweight Materials Market, by Type, $Billion, 2017- 2023 Figure 7.6: North America Lightweight Materials Market, by Country, $Billion, 2017- 2023 Figure 7.7: Europe Lightweight Materials Market, by Type, $Billion, 2017- 2023 Figure 7.8: Composites Innovative Cluster in European Lightweight Materials Market Figure 7.9: Europe Lightweight Materials Market, by Country, $Billion, 2017- 2023 Figure 7.10: ME&A Lightweight Materials Market, by Type, $Billion, 2017- 2023 Figure 7.11: South America Lightweight Materials Market, by Type, $Billion, 2017-2023 Figure 8.1: Overall Financials, 2014-2016 Figure 8.2: Geographic Revenue Mix, 2014- 2016 Figure 8.3: Business Segment Revenue Mix, 2014-2016 Figure 8.4: Overall Financials, 2014-2016 Figure 8.5: Geographic Revenue Mix, 2014- 2016 Figure 8.6: Business Segment Revenue Mix, 2014-2016 Figure 8.7: Overall Financials, 2014-2016 Figure 8.8: Geographic Revenue Mix, 2014- 2016 Suppliers Figure 5.10: Composites Lightweight Materials Market, by Application, $Billion (2017 – 2023) Figure 5.11: Composites Lightweight Materials Market, by Region, Million Tons (2017 – 2023) Figure 5.11: Plastics Lightweight Market Size, $Billion (2016 – 2023) Figure 5.12: Plastics Lightweight Materials Market, by Application, $Billion (2017 – 2023) Figure 5.13: Plastics Lightweight Materials Market, by Region, Million Tons (2017 – 2023) Figure 6.1: Global Lightweight Materials Market, by Application, $Billion Figure 6.2: Automotive Lightweight Materials Market, by Type, $Billion (2016 – 2023) Figure 6.3: Weight Saving in Automotive Applications by using Lightweight Materials Figure 6.4: Percent Distribution in Vehicle Weight, By Type and their Applications Figure 6.5: Aerospace & Defense Lightweight Materials Market, by Type, $Billion (2017 – 2023) Figure 6.6: Aircraft Material Composition of B767 & B787 Figure 6.7: Aircraft Market Share, By Material Figure 6.8: Airline Passenger Traffic, by Region, 2015-2035 Figure 6.9: New Airplane Demand, By Region, 2016-2035 Figure 6.10: Wind Energy Lightweight Materials Market, by Type, $Billion (2017 – 2023) Figure 6.11: Annual Wind Energy Installations, 2011-2016 Figure 6 12: Trend Towards the Increase in Size of Wind Turbines, 1985-2015 Figure 6.13: Others Lightweight Materials Market, by type, $Billion (2017 – 2023) www.bisresearch.com
Global Lightweight Materials Market Analysis and Forecast, 2017-2023 LIST OF FIGURES Figure 8.36: Geographic Revenue Mix, 2014- 2016 Figure 8.37: Business Segment Revenue Mix, 2014-2016 Figure 8.38: Overall Financials, 2014-2016 Figure 8.39: Geographic Revenue Mix, 2014- 2016 Figure 8.40: Business Segment Revenue Mix, 2014-2016 Figure 8.41: Overall Financials, 2014-2016 Figure 8.42: Business Segment Revenue Mix, 2014-2016 Figure 8.43: Overall Financials, 2014-2016 Figure 8.44: Business Segment Revenue Mix, 2014-2016 Figure 8.45: Overall Financials, 2014-2016 Figure 8.46: Geographic Revenue Mix, 2014- 2016 Figure 8.47: Business Segment Revenue Mix, 2014-2016 Figure 8.48: Overall Financials, 2014-2016 Figure 8.49: Geographic Revenue Mix, 2014- 2016 Figure 8.50: Business Segment Revenue Mix, 2014-2016 Figure 8.51: Overall Financials, 2014-2016 Figure 8.52: Geographic Revenue Mix, 2013- 2015 Figure 8.53: Business Segment Revenue Mix, 2013-2015 Figure 8.54: Overall Financials, 2014-2016 Figure 8.55: Geographic Revenue Mix, 2013- 2015 Figure 8.56: Business Segment Revenue Mix, 2013-2015 Figure 8.57: Overall Financials, 2014-2016 Figure 8.58: Geographic Revenue Mix, 2014- 2016 Figure 8.59: Business Segment Revenue, 2014- 2015 Figure 8.60: Overall Financials, 2014-2016 Figure 8.61: Geographic Revenue Mix, 2014- 2016 Figure 8.63: Business Segment Revenue Mix, Figure 8.9: Business Segment Revenue Mix, 2014-2016 Figure 8.10: Overall Financials, 2013-201 Figure 8.11: Geographic Revenue Mix, 2013- 2015 Figure 8.12: Overall Financials, 2013-2015 Figure 8.13: Geographic Revenue Mix, 2013- 2015 Figure 8.14: Segment Revenue Mix, 2013-2015 Figure 8.15: Overall Financials, 2014-2016 Figure 8.16: Geographic Revenue Mix, 2014- 2016 Figure 8.17: Business Segment Revenue Mix, 2014-2016 Figure 8.18: Overall Financials, 2014-2016 Figure 8.19: Geographic Revenue Mix, 2014- 2016 Figure 8.20: Business Segment Revenue Mix, 2014-2016 Figure 8.21: Overall Financials, 2013-2015 Figure 8.22: Overall Financials, 2014-2016 Figure 8.23: Geographic Revenue Mix, 2014- 2016 Figure 8.24: Business Segment Revenue Mix, 2014-2016 Figure 8.25: Overall Financials, 2014-2016 Figure 8.26: Geographic Revenue Mix, 2014- 2016 Figure 8.27: Business Segment Revenue Mix, 2014-2016 Figure 8.27: Overall Financials, 2013-2015 Figure 8.28: Business Segment Revenue Mix, 2013-2015 Figure 8.29: Overall Financials, 2014-2016 Figure 8.30: Geographic Revenue Mix, 2014- 2016 Figure 8.31: Business Segment Revenue Mix, 2014-2016 Figure 8.32: Overall Financials, 2014-2016 Figure 8.33: Geographic Revenue Mix, 2014- 2016 Figure 8.34: Business Segment Revenue Mix, 2014-2016 Figure 8.35: Overall Financials, 2014-2016 www.bisresearch.com
Global Lightweight Materials Market Analysis and Forecast, 2017-2023 LIST OF FIGURES 2014-2016 Figure 8.64: Overall Financials, 2013-2015 Figure 8.65: Geographic Revenue Mix, 2013- 2015 Figure 8.66: Business Segment Revenue Mix, 2013-2015 www.bisresearch.com
Global Lightweight Materials Market Analysis and Forecast, 2017-2023 DISCLAIMER BIS Research provides valuable market intelligence to an exclusive group of customers in response to orders. The report is licensed for the customer’s internal use only and is subject to restrictions set henceforth. This document and its contents are confidential and may not be further distributed, published or reproduced, in whole or in part, by any medium or in any form for any purpose, without the express written consent of BIS Research. Customer will not disclose the contents of the report, whether directly in any media or indirectly through incorporation in a database, marketing list, report or otherwise, or use or permit the use of Information to generate any statistical or other information that is or will be provided to third parties; or voluntarily produce Information in legal proceedings. Market reports are based on expectations, estimates and projections as of the date such information is available. Any recommendation contained in this report may not be suitable for all investors or businesses. The market conclusions drawn are necessarily based upon a number of estimates and assumptions that, while considered reasonable by BIS Research as of the date of such statements, are inherently subject to market fluctuations and business, economic and competitive uncertainties and contingencies. For more details regarding permission, please contact us: Email: sales@bisresearch.com Tel: +1 650 228 0182 www.bisresearch.com