Download
1 / 9
100 likes | 127 Views
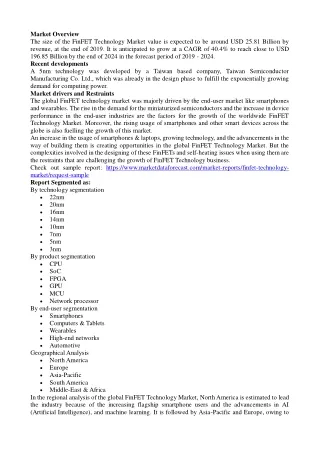
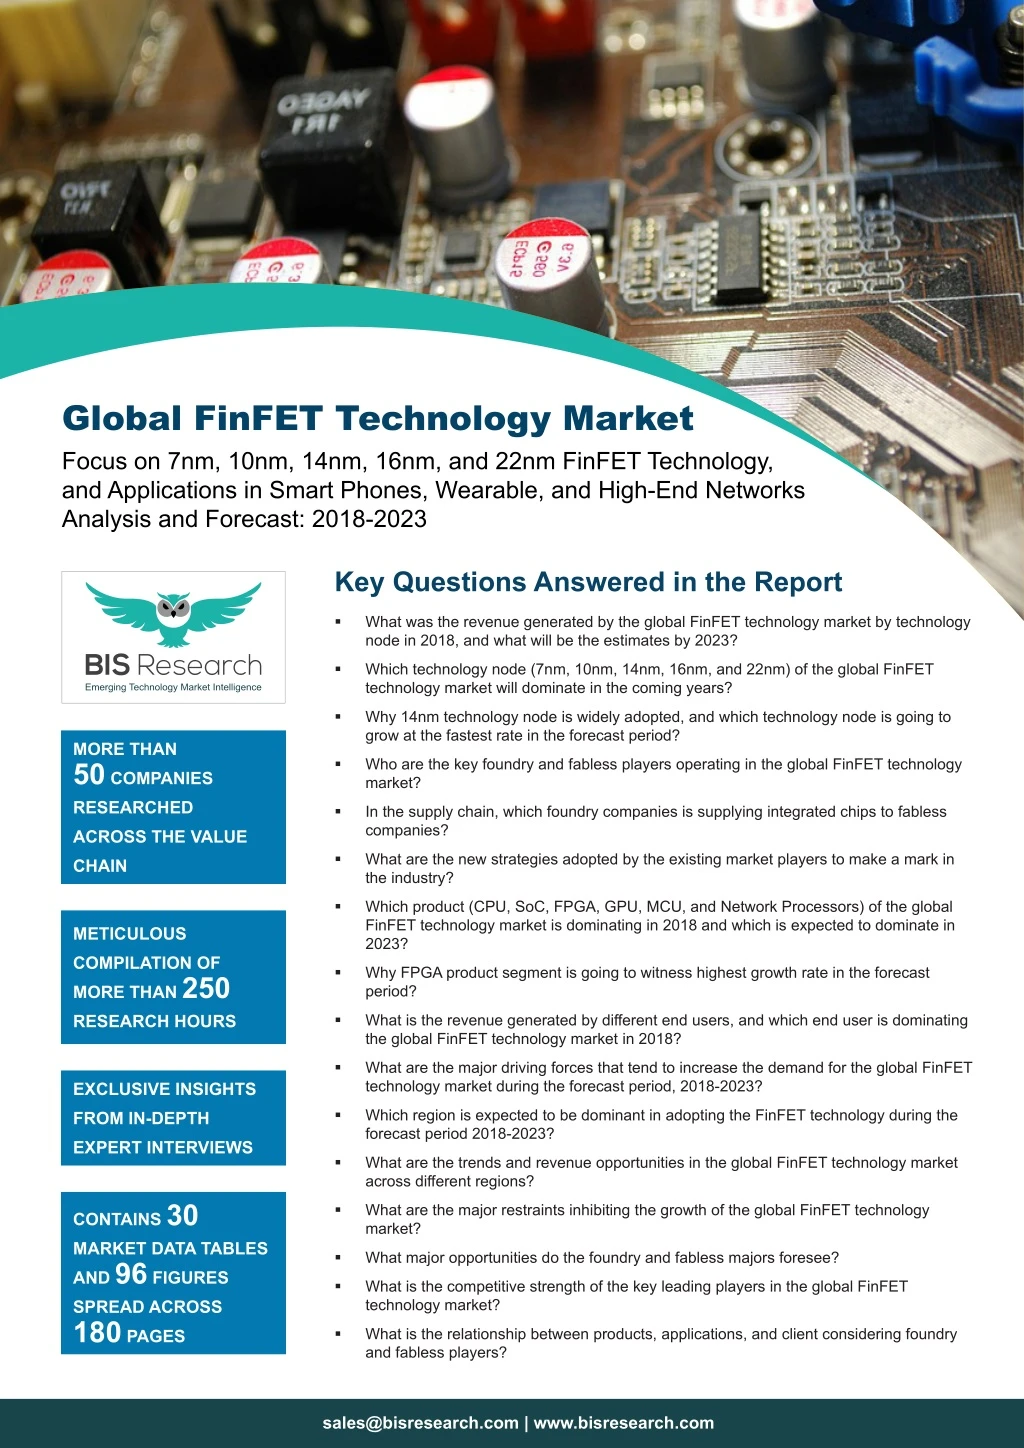
The use of advanced technology nodes for producing compact and efficient devices has changed the market paradigm by providing consumers with fast and efficient processors. The different technology nodes such as 7nm, 10nm, 14nm, 16nm, and 22nm are manufactured with FinFET technology. In terms of adoption, the 14nm technology node is widely used owing to its adaptability in low power and high performance application areas.

E N D
Global FinFET Technology Market Focus on 7nm, 10nm, 14nm, 16nm, and 22nm FinFET Technology, and Applications in Smart Phones, Wearable, and High-End Networks Analysis and Forecast: 2018-2023 Key Questions Answered in the Report What was the revenue generated by the global FinFET technology market by technology node in 2018, and what will be the estimates by 2023? Which technology node (7nm, 10nm, 14nm, 16nm, and 22nm) of the global FinFET technology market will dominate in the coming years? Why 14nm technology node is widely adopted, and which technology node is going to grow at the fastest rate in the forecast period? MORE THAN 50 COMPANIES RESEARCHED Who are the key foundry and fabless players operating in the global FinFET technology market? In the supply chain, which foundry companies is supplying integrated chips to fabless companies? ACROSS THE VALUE What are the new strategies adopted by the existing market players to make a mark in the industry? CHAIN Which product (CPU, SoC, FPGA, GPU, MCU, and Network Processors) of the global FinFET technology market is dominating in 2018 and which is expected to dominate in 2023? METICULOUS COMPILATION OF MORE THAN 250 RESEARCH HOURS Why FPGA product segment is going to witness highest growth rate in the forecast period? What is the revenue generated by different end users, and which end user is dominating the global FinFET technology market in 2018? What are the major driving forces that tend to increase the demand for the global FinFET technology market during the forecast period, 2018-2023? EXCLUSIVE INSIGHTS Which region is expected to be dominant in adopting the FinFET technology during the forecast period 2018-2023? FROM IN-DEPTH EXPERT INTERVIEWS What are the trends and revenue opportunities in the global FinFET technology market across different regions? CONTAINS 30 MARKET DATA TABLES AND 96 FIGURES SPREAD ACROSS 180 PAGES What are the major restraints inhibiting the growth of the global FinFET technology market? What major opportunities do the foundry and fabless majors foresee? What is the competitive strength of the key leading players in the global FinFET technology market? What is the relationship between products, applications, and client considering foundry and fabless players? sales@bisresearch.com | www.bisresearch.com
Table of Contents Market Drivers Market Restraints Market Opportunities SCOPE & RESEARCH METHODOLOGY Scope of the Report Key Strategies & Developments Leading Player Analysis FinFET Technology Market Research Methodology Industry Technology trends Changes in Gate Material Changes in Gate Structure Extreme Ultra Violet (EUV) Lithography Change in Wafer Dimensions Moore’s Law for Producing Various FinFET Technologies Supply Chain Analysis Patent Analysis Heat Map COMPANY PROFILES MARKET DYNAMICS Overview COMPETITIVE INSIGHTS Taiwan Semiconductor Manufacturing Company Limited (TSMC) Intel Corporation Assumptions and Limitations Introduction 7nm FinFET Technology Node 10nm FinFET Technology Node 14nm FinFET Technology Node 16nm FinFET Technology Node 22nm FinFET Technology Node INDUSTRY ANALYSIS Samsung Electronics Co., Ltd. GLOBAL FINFET TECHNOLOGY MARKET (BY TECHNOLOGY NODE) Semiconductor Manufacturing International Corporation (SMIC) GLOBAL FINFET TECHNOLOGY MARKET (BY TYPE) Introduction Silicon on Insulator (SOI) FinFET Bulk FinFET United Microelectronic Corporation (UMC) GLOBALFOUNDRIES Inc. GLOBAL FINFET TECHNOLOGY MARKET (BY PRODUCT) Introduction Central Processing Unit (CPU) System-on-Chip (SoC) Field-Programmable Gate Graphics Processing Unit (GPU) Microcontroller Unit (MCU) Network Processors Qualcomm Incorporated MediaTek Inc. GLOBAL FINFET TECHNOLOGY MARKET (BY END USER) Xilinx Inc. Nvidia Corporation GLOBAL FINFET TECHNOLOGY MARKET (BY REGION) Introduction Smartphones Computers and Tablets Wearables Automotive High End Networks Overview North America Asia Pacific Europe Rest-of-the-World VIEW COMPLETE TABLE OF CONTENT sales@bisresearch.com | www.bisresearch.com
List of Tables 1. Impact Analysis of Market Drivers 2. Impact Analysis of Market Restraints 3. Impact Analysis of Market Opportunities 4. Comparison of Gate Cost and Wafer Cost of FinFET and FD-SOI 5. Heat Map (Foundry Companies vs. Fabless Semiconductor Companies) 6. Global FinFET Technology Market (by Technology Node), $Billion, 2016 - 2023 7. Global 7nm FinFET Technology Market, (by Region), $Billion, 2016 - 2023 8. Global 10nm FinFET Technology Market (by Region), $Billion, 2016 - 2023 9. Global 14nm FinFET Technology Market (by Region), $Billion, 2016 - 2023 10. Global 16nm FinFET Technology Market (by Region), $Billion, 2016 - 2023 11. Global 22nm FinFET Technology Market (by Region), $Billion, 2016 - 2023 12. Global FinFET Technology Market (by Product), $ Billion, 2016-2023 13. CPU Offering by Key Player, by Technology Node 14. Global FinFET Technology Market for Central Processing Unit (by Region), $Billion, 2016 - 2023 15. Global FinFET Technology Market for System-on-Chip (by Region), $Billion, 2016 - 2023 16. Global FinFET Technology Market for Field Programmable Gate Array (by Region), $Billion, 2016 - 2023 17. Global FinFET Technology Market for Graphics Processing Unit (by Region), $Billion, 2016 - 2023 18. Global FinFET Technology Market for Micro Controller Unit (by Region), $Billion, 2016 - 2023 19. Global FinFET Technology Market for Network Processors (by Region), $Billion, 2016 - 2023 20. Global FinFET Technology Market (by End-User), $Billion, 2016 - 2023 21. Global FinFET Technology Market in Smartphone (by Region), $Billion, 2016 - 2023 22. Global FinFET Technology Market in Computers and Tablets (by Region), $Billion, 2016 - 2023 23. Global FinFET Technology Market in Wearables (by Region), $Billion, 2016 - 2023 24. Global FinFET Technology Market in Automotive (by Region), $Billion, 2016 - 2023 25. Global FinFET Technology Market in High End Networks (by Region), $Billion, 2016 - 2023 26. Global FinFET Technology Market (by Region), $Billion, 2016 - 2023 27. North America FinFET Technology Market (by Country), $Billion, 2016 - 2023 28. Asia-Pacific FinFET Technology Market (by Country), $Billion, 2016 - 2023 29. Europe FinFET Technology Market (by Country), $Billion, 2016 - 2023 30. Rest-of-the-World FinFET Technology Market (by Country), $Billion, 2016 - 2023 sales@bisresearch.com | www.bisresearch.com
Table of Figures 1. Global FinFET Technology Market Outlook, $Billion, 2018 and 2023 2. Global FinFET Technology Market (by Technology Node), $Billion, 2018 and 2023 3. Global FinFET Technology Market (by Product), $Billion, 2018 and 2023 4. Global FinFET technology Market (by End-user), $Billion, 2018 and 2023 5. Global FinFET Technology Market (by Region), $Billion, 2018 and 2023 6. Global FinFET Technology Market (by Region), $Billion, 2017-2023 7. Market Dynamics and Impact Analysis 8. Global Smartphone Penetration, 2016-17 (Million Units) 9. Cost per 100M Gates ($) vs Dimensions 10. Cost per 100M Gates ($) vs Process 11. Global IC Market, $Billion, (2014-2020) 12. Key Strategies and Developments 13. Product Launch, 2015-2019 14. Partnership and Collaborations, 2015-2019 15. Others Developments, 2015-2019 16. Analysis of Leading Players in FinFET Technology Market 17. Evolution of Lithography Technique 18. FinFET Technology and Moore’s Law 19. Supply Chain Analysis 20. Patent Filings at 22/20nm Technology Node (2017-19) 21. Patent Filings at 16nm Technology Node (2017-19) 22. Patent Filings at 14nm Technology Node (2017-19) 23. Patent Filings at 10nm Technology Node (2017-19) 24. Patent Filings at 7nm Technology Node (2017-19) 25. Global FinFET Technology Market (by Technology Node), $Billion, 2018 and 2023 26. Global 7nm FinFET Technology Market, $Billion, 2018 and 2023 27. Global 10nm FinFET Technology Market, $Billion, 2018 and 2023 28. Global 14nm FinFET Technology Market, $Billion, 2018 and 2023 29. Global 16nm FinFET Technology Market, $Billion, 2018 and 2023 30. Global 22nm FinFET Technology Market, $Billion, 2018 and 2023 31. Global FinFET Technology Market (by Product), $Billion, 2018 and 2023 32. Global FinFET Technology Market (by CPU), $Billion, 2018 and 2023 33. Global FinFET Technology Market (by SoC), $Billion, 2018 and 2023 34. Global FinFET Technology Market (by FPGA), $Billion, 2018 and 2023 35. Global FinFET Technology Market (by GPU), $Billion, 2018 and 2023 36. Global FinFET Technology Market (by MCU), $Billion, 2018 and 2023 37. Global FinFET Technology Market (by Network Processors), $Billion, 2018 and 2023 38. Global FinFET Technology Market (by End User), $Billion, 2018 and 2023 39. 5G Smartphones Volume Shipment, 2019-2027 40. Global FinFET Technology Market in Smartphone (by Region), $Billion, 2018 and 2023 41. Global FinFET Technology Market in Computers and Tablets (by Region), $Billion, 2018 and 2023 42. Global FinFET Technology Market in Wearables (by Region), $Billion, 2018 and 2023 43. Global FinFET Technology Market in Automotive (by Region), $Billion, 2018 and 2023 44. Global FinFET Technology Market in High End Networks (by Region), $Billion, 2018 and 2023 45. Global FinFET Technology Market (by Region) 46. Global FinFET Technology Market (by Region), $Billion, 2018 and 2023 47. North America FinFET Technology Market (by Country), $Billion, 2018 and 2023 48. The U.S. FinFET Technology Market, $Billion, 2016-2023 49. Canada FinFET Technology Market, $Billion, 2016-2023 50. Mexico FinFET Technology Market, $Billion, 2016-2023 51. Asia-Pacific FinFET Technology Market (by Country), $Billion, 2018 and 2023 52. China FinFET Technology Market, $Billion, 2016-2023 53. Japan FinFET Technology Market, $Billion, 2016-2023 54. South Korea FinFET Technology Market, $Billion, 2016-2023 55. India FinFET Technology Market, $Billion, 2016-2023 56. Taiwan FinFET Technology Market, $Billion, 2016-2023 57. Rest of Asia-Pacific FinFET Technology Market, $Billion, 2016-2023 58. Europe FinFET Technology Market (by Country), $Billion, 2018 and 2023 sales@bisresearch.com | www.bisresearch.com
Table of Figures 59. Germany FinFET Technology Market, $Billion, 2016-2023 60. U.K. FinFET Technology Market, $Billion, 2016-2023 61. France FinFET Technology Market, $Billion, 2016-2023 62. Spain FinFET Technology Market, $Billion, 2016-2023 63. Rest-of-Europe FinFET Technology Market, $Billion, 2016-2023 64. Rest-of-the-World FinFET Technology Market, $Billion, 2018 and 2023 65. South America FinFET Technology Market, $Billion, 2016-2023 66. Middle East and Africa FinFET Technology Market, $Billion, 2016-2023 67. Profiles by Ownership Type 68. Taiwan Semiconductor Manufacturing Limited: Overall Financials, 2015-2017 69. Taiwan Semiconductor Manufacturing Limited: Net Revenue (by Region), 2015-2017 70. Intel Corporation: Overall Financials, 2016-2018 71. Intel Corporation: Net Revenue (by Segment), 2016-2018 72. Intel Corporation: Net Revenue (by Region), 2016-2018 73. Samsung Electronics Co., Ltd.: Overall Financials, 2015-2017 74. Samsung Electronics Co., Ltd.: Net Revenue (by Segment), 2015-2017 75. Samsung Electronics Co., Ltd.: Net Revenue (by Region), 2015-2017 76. Semiconductor Manufacturing International Corporation: Overall Financials, 2015-2017 77. Semiconductor Manufacturing International Corporation: Net Revenue (by Segment), 2015-2017 78. Semiconductor Manufacturing International Corporation: Net Revenue (by Region), 2015-2017 79. United Microelectronic Corporation: Overall Financials, 2015-2017 80. United Microelectronic Corporation: Net Revenue (by Segment), 2015-2017 81. United Microelectronic Corporation: Net Revenue (by Region), 2015-2017 82. Qualcomm Incorporated: Overall Financials, 2016-2018 83. Qualcomm Incorporated: Net Revenue (by Business Segment), 2016-2018 84. Qualcomm Incorporated: Net Revenue (by Region), 2016-2018 85. MediaTek Inc.: Overall Financials, 2015-2017 86. MediaTek Inc.: Net Revenue (by Region), 2015-2017 87. Xilinx Inc.: Overall Financials, 2016-2018 88. Xilinx Inc.: Net Revenue (by Region), 2016-2018 89. Nvidia Corporation: Overall Financials, 2016-2018 90. Nvidia Corporation: Net Revenue (by Business Segment), 2016-2018 91. Nvidia Corporation: Net Revenue (by Region), 2016-2018 92. Scope of the Report 93. Secondary Data Sources 94. Top Down and Bottom up Approach 95. FinFET Technology Market Influencing Factors 96. Assumptions and Limitations sales@bisresearch.com | www.bisresearch.com
Research Scope & BIS Methodology 1. Scope of the Report The report constitutes an extensive study of the FinFET technology market. It includes a thorough analysis of different technologies used in the FinFET technology market along with the various products available. The FinFET technology market has been further segmented in terms of application in order to understand the behavior of different verticals using FinFET technology. The report further explains the driving forces, restraints, and growth opportunities of the FinFET technology market. The major players in the FinFET technology industry have been identified on the basis of revenue generation pertaining to the FinFET technology market, R&D initiatives, regional presence, and strategic developments related to FinFET technology. A detailed company profiling has been done in order to understand the players’ strategic behavior. The FinFET technology market has been further explained and analyzed on the basis of region. The regional analysis has been done for four regions, namely North America, Europe, Asia-Pacific, and Rest-of- the-World. Moreover, the country analysis has also been done in order to obtain a clear picture of the FinFET technology market in each region. The increasing adoption of advanced technology nodes and new lithography techniques coupled with the ongoing developments in numerous regions by the governments as well as the private entities are some of the factors based on which the countries’ growth rate has been calculated. 2. Global FinFET Technology Market Research Methodology The research methodology design adopted for this specific study includes a mix of data collected from the primary and secondary sources. Both the primary sources (in-house experts, industry leaders, and market players) and the secondary sources (a host of paid and unpaid databases), along with the analytical tools have been employed to build the forecast and predictive models. Primary Data Sources The primary sources involve the industry experts from the FinFET technology industry, including the pure-play players, integrated device manufacturers (IDM), and fabless players, among others. The resources, such as CEOs, vice presidents, marketing directors, and technology & innovation directors, among others, have been interviewed to obtain and verify both the qualitative and quantitative aspects of this research study. The key data points taken from the primary sources include: Validation and triangulation of all the numbers and graphs Validation of report’s segmentation and key qualitative findings Understanding the competitive landscape Current and proposed production values of a particular product by market players Validation of the numbers of various markets for different technology type Percentage split of individual markets for regional analysis Emerging trends and R&D investments across regions sales@bisresearch.com | www.bisresearch.com
Research Scope & BIS Methodology Figure 1: Research Methodology List of Tables Scope Definition Research Design Market Study Qualitative Quantitative Primary Interviews/ Secondary Research Top Down Primary & Secondary Data Report Writing Data Validation Data Analysis Data Collection Secondary Data Sources The research study involves the extensive usage of the secondary sources such as databases, company websites, and annual reports. The key data points taken from the secondary sources include: Segmentation breakups, split-ups, and percentage shares Data for market value Key industry trends of the top players of the market Qualitative insights into various aspects of the market, key trends, and emerging areas of innovation sales@bisresearch.com | www.bisresearch.com
Research Scope & BIS Methodology Figure 4: Data Triangulation List of Tables The following figure exhibits data triangulation considered: BIS Research Internal Repository Key Players Competitive Landscape Opportunities/Restraints Market Size and Market Share (2017) Influencing Factors Market Estimates Regional Analysis Information Sourced DATA TRIANGULATION Primary Sources Secondary Sources Primary Sources Secondary Sources DEMAND SIDE Annual Reports of key Insdustry Players SEC Fillings Investor Presentations Journals Press Release Paid and Unpaid Databases World Semiconductor Trade Statistics (WSTS) Eurpean Standards Organization (ESO) INTERVIEWS WITH End-Users Automotive Consumer Device Manufacturers Insustrial DEMAND SIDE INTERVIEWS WITH Senior Managers of Major Companies in the Foundry Network Tier II Players Distributors Retailers OEMs REQUEST FOR SAMPLE sales@bisresearch.com | www.bisresearch.com
BIS Research 39111 Paseo Padre PKWY STE 313, Fremont CA 94538-1686, Tel: +1-510-404-8135 Global Delivery Centre Tapasya Corp Heights, Subarea, Sector 126, Noida, NCR-201303 India Tel: +91 120 4261540 / +91 120 4261544 To know more about us, please visit our website: bisresearch.com For other queries contact: sales@bisresearch.com sales@bisresearch.com | www.bisresearch.com sales@bisresearch.com | www.bisresearch.com