Download
1 / 11
110 likes | 120 Views
Ticketing solutions was the largest application of blockchain in oil & gas while commodity trading is to be the fastest growing application for blockchain in oil & gas in the region during the forecast period.

E N D
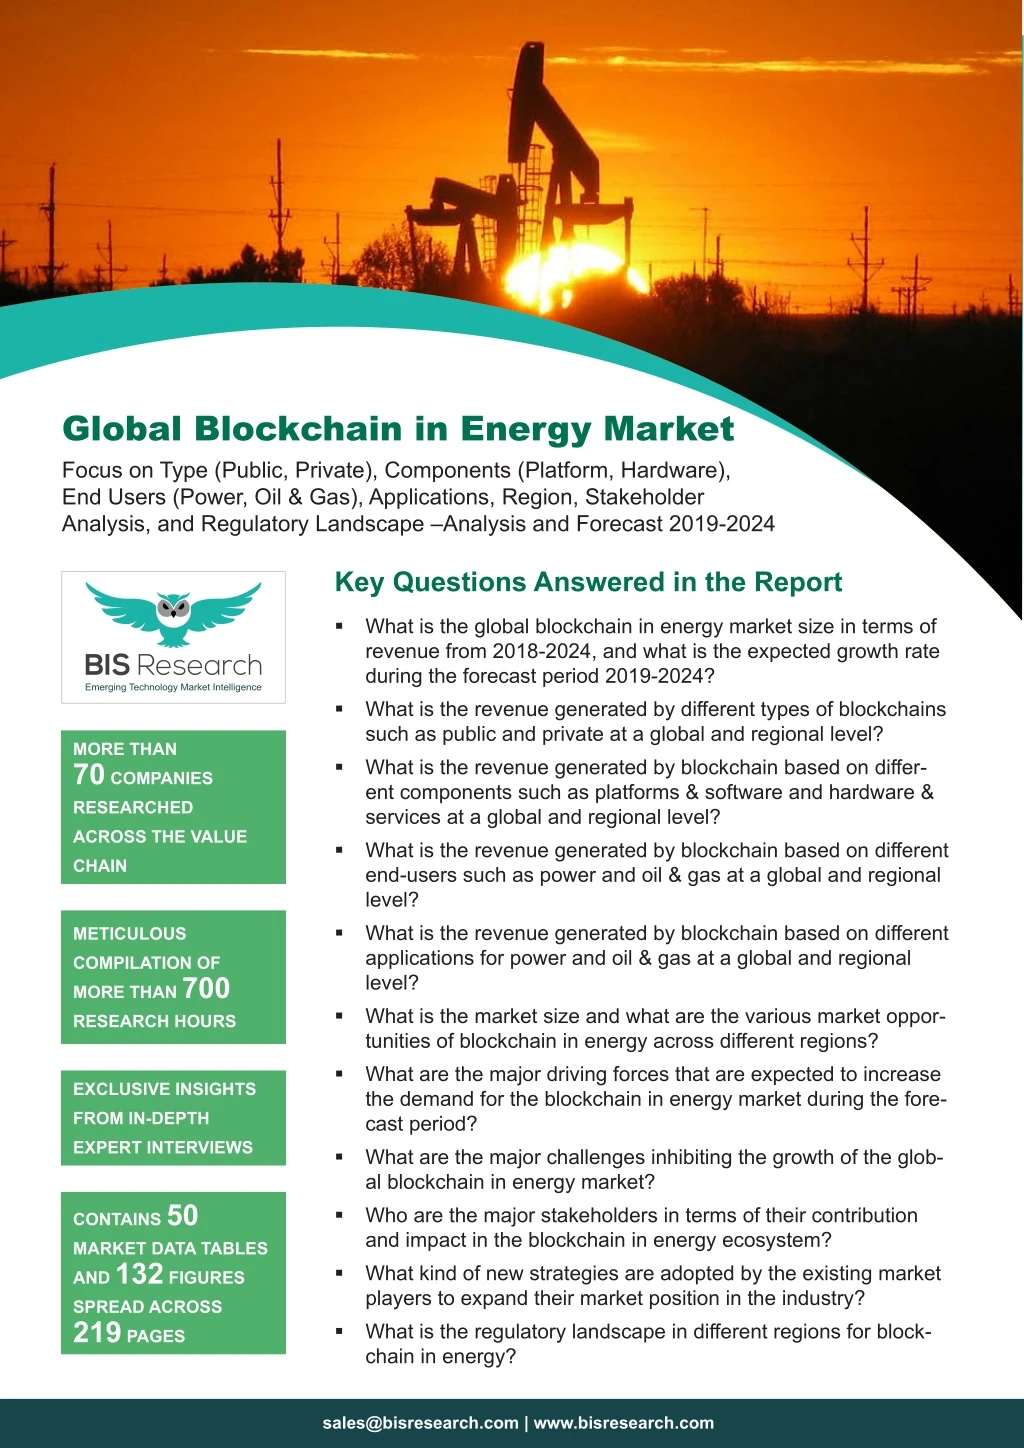
Global Blockchain in Energy Market Focus on Type (Public, Private), Components (Platform, Hardware), End Users (Power, Oil & Gas), Applications, Region, Stakeholder Analysis, and Regulatory Landscape –Analysis and Forecast 2019-2024 Key Questions Answered in the Report What is the global blockchain in energy market size in terms of revenue from 2018-2024, and what is the expected growth rate during the forecast period 2019-2024? What is the revenue generated by different types of blockchains such as public and private at a global and regional level? What is the revenue generated by blockchain based on differ- ent components such as platforms & software and hardware & services at a global and regional level? What is the revenue generated by blockchain based on different end-users such as power and oil & gas at a global and regional level? What is the revenue generated by blockchain based on different applications for power and oil & gas at a global and regional level? What is the market size and what are the various market oppor- tunities of blockchain in energy across different regions? What are the major driving forces that are expected to increase the demand for the blockchain in energy market during the fore- cast period? What are the major challenges inhibiting the growth of the glob- al blockchain in energy market? Who are the major stakeholders in terms of their contribution and impact in the blockchain in energy ecosystem? What kind of new strategies are adopted by the existing market players to expand their market position in the industry? What is the regulatory landscape in different regions for block- chain in energy? MORE THAN 70 COMPANIES RESEARCHED ACROSS THE VALUE CHAIN METICULOUS COMPILATION OF MORE THAN 700 RESEARCH HOURS EXCLUSIVE INSIGHTS FROM IN-DEPTH EXPERT INTERVIEWS CONTAINS 50 MARKET DATA TABLES AND 132 FIGURES SPREAD ACROSS 219 PAGES sales@bisresearch.com | www.bisresearch.com
Table of Contents Introduction Types of Consensus Protocols Blockchain Structure Overview - Blockchain in Energy Industry SCOPE & RESEARCH METHODOLOGY Report Scope Blockchain in Energy Market Research Methodology Market Drivers Market Restraints Market Opportunities BLOCKCHAIN IN ENERGY MARKET Key Market Developments and Strategies Competitive Positioning of Key Players in Blockchain in Energy Market MARKET DYNAMICS COMPANY PROFILES BP p.l.c. COMPETITIVE LANDSCAPE E.ON SE Role of Internet of Things in Blockchain in Energy Market Stakeholder Analysis Consortiums and Associations Regulatory Landscape in the Blockchain Ecosystem Investment and Funding Landscape Electron Energy Web Foundation INDUSTRY ANALYSIS Grid Plus, Inc. IBM CORPORATION GLOBAL BLOCKCHAIN IN ENERGY MARKET (BY TYPE) LO3 Energy, Inc. MICROSOFT CORPORATION Market Assumptions Market Limitations Market Overview Public Private GLOBAL BLOCKCHAIN IN ENERGY MARKET, (BY COMPONENT) Ondiflo ORACLE CORPORATION GLOBAL BLOCKCHAIN IN ENERGY MARKET, (BY END USER) Market Overview Platform Hardware and Ancillary Services Power Ledger SP GROUP TenneT Holding B.V. GLOBAL BLOCKCHAIN IN ENERGY MARKET (BY APPLICATIONS) Market Overview Power Oil & Gas TOKYO ELECTRIC POWER COMPANY HOLDINGS GLOBAL BLOCKCHAIN IN ENERGY MARKET (BY REGION) VAKT Global Ltd. Market Overview Power Applications Oil & Gas Applications North America Europe Asia-Pacific Rest-of-the-World (RoW) VIEW COMPLETE TABLE OF CONTENT sales@bisresearch.com | www.bisresearch.com
List of Tables Application), 2018-2024, $Million 26. Europe in Blockchain in Energy (by Oil & Gas Applications), 2018-2024, $Million 27. Europe Blockchain in Energy Market (by Country), 2018-2024, $Million 28. Key Projects in Italy in the Blockchain in Energy 29. Key Projects in Rest-of-Europe in the Blockchain in Energy Market 30. Asia-Pacific Blockchain in Energy Market (by Power Application), 2018-2024, $Million 31. Asia-Pacific in Blockchain in Energy (by Oil & Gas Application), 2018-2024, $Thousand 32. Asia-Pacific Blockchain in Energy Market (by Country), 2018-2024, $Million 33. Australia Government Initiatives for Energy Conservation 34. Australia Blockchain in Energy Projects 35. Japan Blockchain in Energy Projects 36. Rest–of-Asia-Pacific Blockchain in Energy Projects 37. RoW Blockchain in Energy Market (by Power Application), 2018-2024, $Million 38. RoW in Blockchain in Energy (by Oil & Gas Applications), 2018-2024, $Million 39. E.ON SE: Initiatives in Blockchain in Energy 40. Electron: Project Portfolio 41. Energy Web Foundation: Blockchain-based Solutions Portfolio 42. Grid Plus, Inc.: Project Portfolio 43. IBM Corporation: Product Portfolio 44. LO3 Energy, Inc: Project Portfolio 45. Microsoft Corporation: Product Portfolio 46. Ondiflo: Use Cases 47. Oracle Corporation: Product Portfolio 48. Power Ledger: Project Portfolio 49. SP Group: Initiatives in Energy Blockchain 50. Tokyo Electric Power Company Holdings: Projects and Investments in Blockchain 1. Impact Analysis of Drivers 2. Levelized Cost of Electricity (LCOE) for Distributed Energy Sources 3. Initiatives by Utilities of Various Countries to Promote Blockchain in Energy 4. Impact Analysis of Restraints 5. Initiatives for the Integration of Blockchain in Oil and Gas Sector 6. Overview of Stakeholder Analysis 7. Key Investments and Funding in Blockchain in Energy Market 8. Global Blockchain in Energy Market (by Type), $Million, 2018-2024 9. Global Blockchain in Energy Market (by Component), $Million, 2018-2024 10. Major Blockchain in Energy Platform projects 11. Blockchain in Energy Hardware and Services 12. Global Blockchain in Energy Market (by End User), $Million, 2018-2024 13. Global Blockchain in Energy Market (by Applications), $Million, 2018-2024 14. Global Blockchain in Energy Market (by Power Applications), $Million, 2018-2024 15. Peer-to-Peer Power Trade Projects, 2016-2019 16. Grid Management & System Operation projects 17. Renewable Energy Certificate Projects 18. Electric Mobility Projects 19. Global Blockchain in Energy Market (by Oil & Gas Applications), $Million, 2018-2024 20. Global Blockchain in En ergy Market (by Region), 2018-2024, $Million 21. North America in Blockchain in Energy (by Power Applications), 2018-2024, $Million 22. North America in Blockchain in Energy (by Oil & Gas Applications), 2018-2024, $Million 23. North America in Blockchain in Energy Market (by Country), 2018-2024, $Million 24. Key Projects in the U.S. in the Blockchain in Energy Market, 2016- 2019 25. Europe in Blockchain in Energy (by Power sales@bisresearch.com | www.bisresearch.com
List of Figures 30. Global Blockchain in Energy Market for Public Blockchain Type, 2018-2024 31. Global Blockchain in Energy Market for Private Blockchain Type, 2018-2024 32. Blockchain Ecosystem with its Components 33. Blockchain Platform Architecture 34. Global Blockchain in Energy Market for Platform, 2018-2024 35. Usage of Mobile Application for Carbon Credit Trading 36. Global Blockchain in Energy Market – Hardware & Ancillary Services, 2018-2024 37. Major End Users for Blockchain in Energy 38. Blockchain Use Cases and Applications Across the Power Supply Chain 39. Global Blockchain in Energy Market for Power Sector, 2018-2024 40. Blockchain Use Cases for Oil & Gas Sector 41. Global Blockchain in Energy Market for Oil & Gas, 2018-2024 42. Major Applications of Blockchain in Energy 43. Blockchain-Enabled Power Trading 44. Power Applications Based Blockchain in Energy Market, 2018-2024 45. Renewable Energy Share of Total Power Generation (2008-2018) 46. Peer-to-Peer Power Trade-Based Blockchain in Energy Market, 2018-2024 47. Global Energy Storage Deployments (2013-2018) 48. Grid Management & System Operation–Based Blockchain in Energy Market, 2018-2024 49. Investments in Renewable Energy for Some Major Countries in 2018 50. Financing Renewable Energy Development– Based Blockchain in Energy Market, 2018-2024 51. EV Charging Based on a Blockchain Platform 52. Electric Mobility– Based Blockchain in Energy Market, 2018-2024 53. Renewable Energy Certificate Management Mechanism 54. Management of Renewable Energy Certificates 1. Factors Affecting the Global Blockchain in Energy Market 2. Global Blockchain in Energy Market Snapshot 3. Global Blockchain in Energy Market (by Blockchain Type), 2019-2024, ($Million) 4. Global Blockchain in Energy Market (by End User), 2019 and 2024 5. Regional Blockchain in Energy Market Snapshot 6. The Blockchain Structure 7. Public Blockchain 8. Private Blockchain 9. Market Dynamics 10. Advantages of Using Blockchain in Virtual Power Plant 11. Strategies Adopted by the Key Players (October 2016-October 2019) 12. Share of Key Market Strategies and Developments (October 2016-October 2019) 13. Project Launches and Developments Share (by Company) 14. Partnerships, Collaborations, and Joint Ventures Share (by Company) 15. Platform Launches Share (by Company) 16. Competitive Positioning of Market Players in Blockchain in Energy Market 17. Blockchain - a Part of the Internet of Energy Ecosystem 18. Stakeholders of Blockchain in Energy Market 19. Some Key Members of Ethereum Enterprise Alliance 20. Some Key Members of Hyperledger Project 21. Some Key Members of Trusted IoT Alliance 22. Effects of Regulations on the Blockchain Market 23. Regulatory Landscape in North America 24. Regulatory Landscape in Europe 25. Regulatory Landscape in Asia-Pacific 26. Regulatory Landscape in Rest-of-the-World 27. Investments in Blockchain in Energy (2016-2018) 28. Types of Blockchains and Their Use Cases 29. Blockchain vs Traditional Computing Networks sales@bisresearch.com | www.bisresearch.com
List of Figures 76. Italy Blockchain in Energy Market, 2018-2024, $Million 77. Rest–of-Europe in Blockchain in Energy Market, 2018-2024, $Million 78. Asia-Pacific Blockchain in Energy Market, 2018-2024, $Million 79. Australia Blockchain in Energy Market, 2018-2024, $Million 80. Japan Blockchain in Energy Market, 2018-2024, $Million 81. Singapore PV Installations in GW from 2003 to 2015 82. Singapore Blockchain in Energy Market, 2018-2024, $Million 83. Rest–of-Asia-Pacific Blockchain in Energy Market, 2018-2024, $Million 84. RoW Blockchain in Energy Market, 2018-2024, $Million 85. Blockchain Key Players in the energy sector 86. BP p.l.c.: Overall Financials, 2016-2018 87. BP p.l.c.: Net Revenue by Business Segment, 2017-2018 88. Research and Development: BP p.l.c.– 2016 to 2018 89. BP p.l.c.: SWOT Analysis 90. E.ON SE: Overall Financials, 2016-2018 91. E.ON SE: Net Revenue by Business Segment, 2017-2018 92. E.ON SE: Net Revenue by Regional Segment, 2016-2018 93. Research and Development: E.ON SE – 2016 to 2018 94. E.ON SE: SWOT Analysis 95. Electron: SWOT Analysis 96. Energy Web Foundation: SWOT Analysis 97. Power Ledger: SWOT Analysis 98. IBM Corporation: Overall Financials, 2016-2018 99. IBM Corporation: Net Revenue by Business Segment, 2016-2018 100. IBM Corporation: Net Revenue by Regional Segment, 2017 2018 101. Research and Development: IBM Corporation – Based Blockchain in Energy Market, 2018-2024 55. Comparison of African Countries Having Least Percentage of Population with Access to Electricity and Their GDPs (2017) 56. Others–Based Blockchain in Energy Market, 2018-2024 57. The Internet of Energy Applications for Oil & Gas Sector 58. Oil & Gas Applications Based Blockchain in Energy Market, 2018-2024 59. Blockchain-Based Ticketing Solutions Mechanism for Oil & Gas 60. Ticekting Solutions – Based Blockchain in Energy Market, 2018-2024 61. Blockchain-Based Commodity Trading Cycle for Oil & Gas 62. Commodity Trading – Based Blockchain in Energy Market, 2018-2024 63. Other Applications Based Blockchain in Energy Market, 2018-2024 64. Global Blockchain in Energy Regional Market Snapshot 65. North America Blockchain in Energy Market, 2018-2024, $Million 66. U.S. Electricity Generation (by Sector) in 2018 67. U.S. Blockchain in Energy Market, 2018-2024, $Million 68. Energy Mix of Canada, 2018 69. Rest-of-North America Blockchain in Energy Market, 2018-2024, $Million 70. Europe Blockchain in Energy Market, 2018-2024, $Million 71. Germany Photo Voltaics Installations in GW from 2003 to 2015 72. Germany Blockchain in Energy Market, 2018-2024, $Million 73. Netherlands Blockchain in Energy Market, 2018-2024, $Million 74. Estonia Blockchain in Energy Market, 2018-2024, $Million 75. Figure 9.12: U.K. Blockchain in Energy Market, 2018-2024, $Million sales@bisresearch.com | www.bisresearch.com
List of Figures 117. SP Group: Net Revenue by Business Segment, 2017-2018 118. SP Group: SWOT Analysis 119. TenneT Holdings B.V.: Overall Financials, 2016-2018 120. TenneT Holdings B.V.: Net Revenue by Business Segment, 2017-2018 121. TenneT Holdings B.V.: SWOT Analysis 122. Tokyo Electric Power Company Holdings: Overall Financials, 2016-2018 123. Tokyo Electric Power Company Holdings: Net Revenue by Business Segment, 2017-2018 124. Research and Development: Tokyo Electric Power Company Holdings – 2016 to 2018 125. Tokyo Electric Power Company Holdings: SWOT Analysis 126. VAKT Global Ltd.: SWOT Analysis 127. Blockchain in Energy Market Scope 128. Report Methodology 129. Primary Interviews Breakdown, by Company, Designation and Region 130. Sources of Secondary Research 131. Data Triangulation 132. Top-Down Bottom-Up Approach for Market Estimation – 2016 to 2018 102. IBM Corporation: SWOT Analysis 103. LO3 Energy, Inc: SWOT Analysis 104. Microsoft Corporation: Overall Financials, 2016-2018 105. Microsoft Corporation: Net Revenue by Business Segment, 2017-2018 106. Microsoft Corporation: Net Revenue by Regional Segment, 2017-2018 107. Research and Development: Microsoft Corporation – 2016 to 2018 108. Microsoft Corporation: SWOT Analysis 109. Ondiflo: SWOT Analysis 110. Oracle Corporation: Overall Financials, 2016-2018 111. Oracle Corporation: Net Revenue by Business Segment, 2017-2018 112. Oracle Corporation: Net Revenue by Regional Segment, 2017-2018 113. Research and Development: Oracle Corporation – 2016 to 2018 114. Oracle Corporation: SWOT Analysis 115. Power Ledger: SWOT Analysis 116. SP Group: Overall Financials, 2016-2018 sales@bisresearch.com | www.bisresearch.com
Research Scope & BIS Methodology 1. Scope of the Report The report is a thorough study of the blockchain in energy market share and market size, including the analysis of blockchain type, components, end user, applications, and region of blockchain in energy industry. The market trends across the leading countries have also been extensively analyzed in the blockchain in energy market study. Further, the market estimated in different sections of the report considered “2018-2024” as the forecast period. 2. Blockchain in Energy Market Research Methodology The research methodology design adopted for this specific study includes a combination of data collected from primary and secondary researches. Both the primary sources (in-house experts, industry leaders, market players, and independent consultants) and the secondary (a host of paid and unpaid databases) sources have been used along with analytical tools to build the forecast and predictive modes. Primary Data Sources The primary sources involve the industry experts from the blockchain in energy market including the related regulatory associations. In the extensive primary research process undertaken for this study, the primary sources further include industry experts and key executives from the prominent companies and organizations in the energy sector. All such resources were interviewed to obtain and verify both the qualitative and the quantitative aspects of this research study. The key data points taken from primary sources include: Validation and triangulation of all the numbers and graphs Validation of report’s segment and key qualitative findings Understanding the competitive landscape Validation of several markets for the systems Percentage split for countries sales@bisresearch.com | www.bisresearch.com
Research Scope & BIS Methodology Figure 1: Research Scope & BIS Methodology Current Market Information and Data Forecast Influencing Factors (Market Trends and Dynamics) Developments Emerging Trends Recent Developments Market Size Market Share Industry Attractiveness Companies Key Market Drivers Market Restraints Market Opportunities Regulatory Landscape Industry Analysis Region-Wise Market Market Size & Share Analysis High Growth Segments Market Size & Forecast: By Blockchain Type By Components By End-users By Applications By Regions Compound Annual Growth Rate (CAGR) Blockchain in Energy Market By Type By By By By Components End-Users Application Region Public Private Platforms & Software Hardware & Services Power Oil & Gas Power Applications Oil & Gas Applications North America Europe Asia-Pacific Rest-of-the- World sales@bisresearch.com | www.bisresearch.com
Research Scope & BIS Methodology Secondary Data Sources This research study involves the usage of extensive secondary sources, directories, company websites, annual reports and investor presentations. It also makes use of databases such as Hoovers, Bloomberg, Business-week, and Factiva to collect the useful information for an extensive, market-oriented, and commercial study of the regional market. Secondary research was done to obtain crucial information about the industry’s value chain, market’s monetary chain, total pool of key players, and the prevalent applications and systems in this sector. The key data points taken from secondary sources include: Segmentation breakups, split-ups, and percentage shares Data for market size Key industry trends of the top players of the market Data Triangulation The process of market engineering involves the calculation of the market statistics, market size estimation, market forecast, market crackdown, and data triangulation (the methodology for these quantitative data processes is explained in the further sections). An extensive primary research study was undertaken to gather information, and authenticate the critical numbers derived through the segmentation types, industry trends, and key players in the market. sales@bisresearch.com | www.bisresearch.com
Research Scope & BIS Methodology Figure 4: Data Triangulation List of Tables The following figure exhibits data triangulation considered: BIS Research Internal Repository Key Players Competitive Landscape Opportunities and Challenges Market Size and Market Share (2018-2024) Marco-Economic Factors Market Estimates Regional Analysis Bis Research Internal Repository DATA TRIANGULATION Primary Sources Secondary Sources Primary Sources Secondary Sources Energy Management and Automation Companies SEC Filings Investor Presentations Journals Press Releases Paid & Unpaid Databases IRENA United States Department of Energy Reports Research Articles VPP Aggregators Utilities Research Organization REQUEST FOR SAMPLE sales@bisresearch.com | www.bisresearch.com
BIS Research 39111 Paseo Padre PKWY STE 313, Fremont CA 94538-1686, Tel: +1-510-404-8135 Global Delivery Centre Tapasya Corp Heights, Subarea, Sector 126, Noida, NCR-201303 India Tel: +91 120 4261540 / +91 120 4261544 To know more about us, please visit our website: bisresearch.com For other queries contact: sales@bisresearch.com sales@bisresearch.com | www.bisresearch.com sales@bisresearch.com | www.bisresearch.com