Download
1 / 11
110 likes | 113 Views
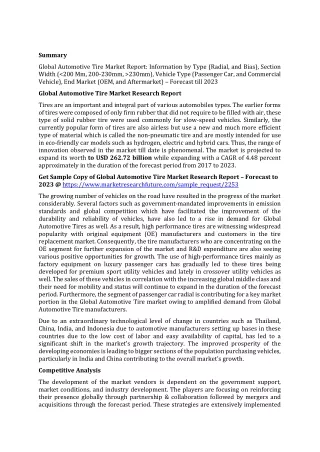
The growing trend for advanced technologies and sensors being used in a vehicle along with the increasing need for vehicle safety has led to the demand for intelligent tires and sensors market. Technological advancements in vehicle tires have played an important role in the growth of the market.

E N D
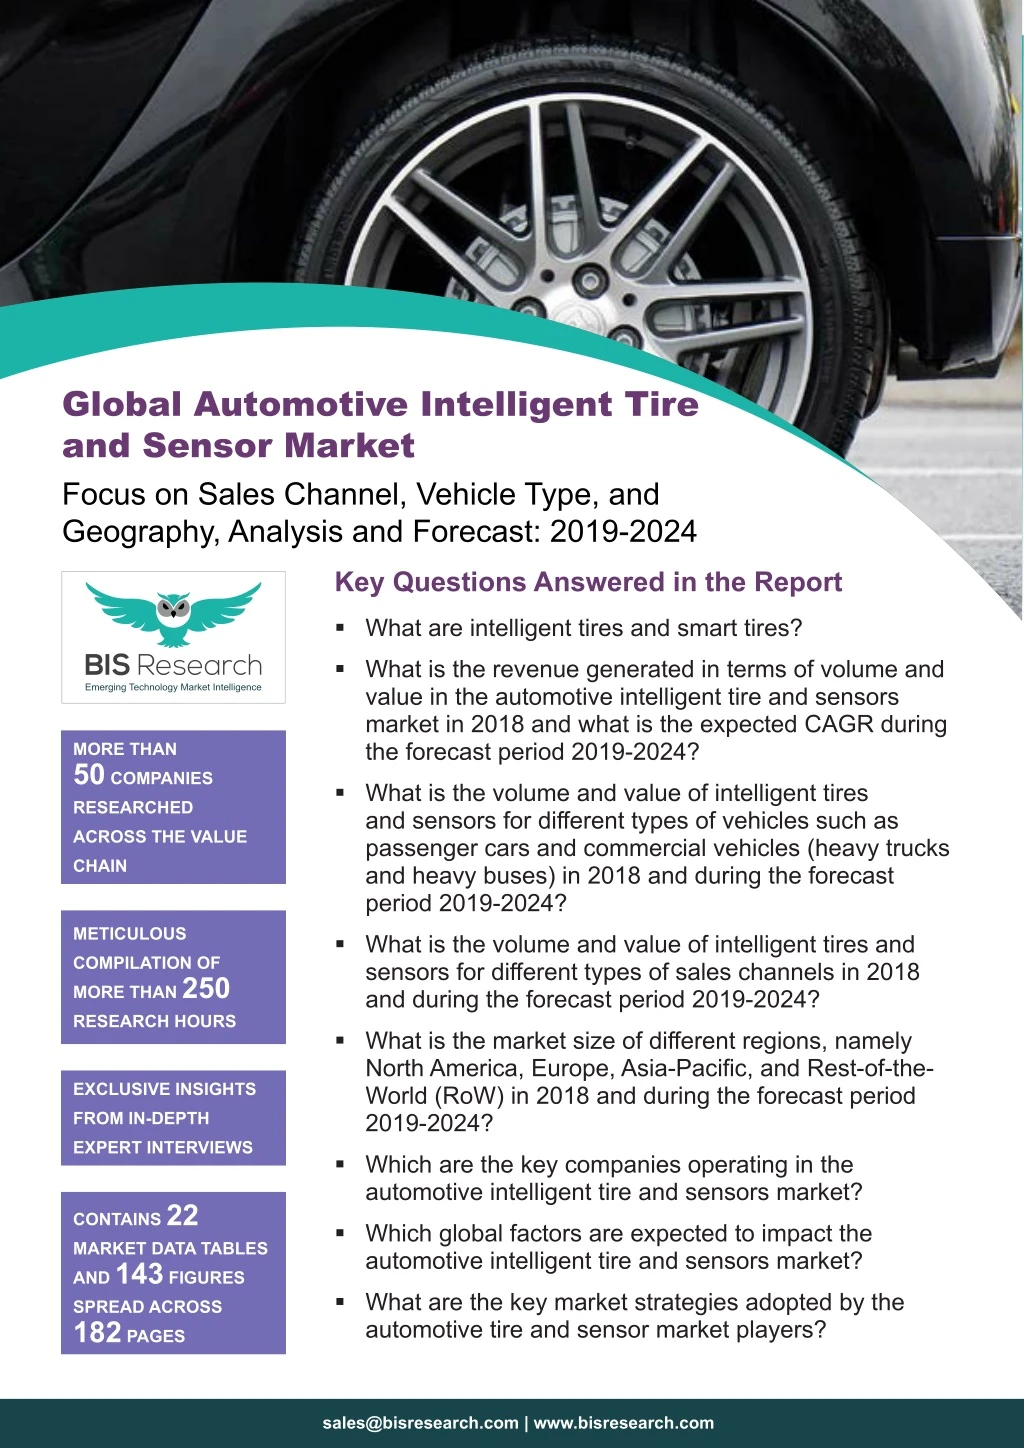
Global Automotive Intelligent Tire and Sensor Market Focus on Sales Channel, Vehicle Type, and Geography, Analysis and Forecast: 2019-2024 Key Questions Answered in the Report What are intelligent tires and smart tires? What is the revenue generated in terms of volume and value in the automotive intelligent tire and sensors market in 2018 and what is the expected CAGR during the forecast period 2019-2024? MORE THAN 50 COMPANIES RESEARCHED What is the volume and value of intelligent tires and sensors for different types of vehicles such as passenger cars and commercial vehicles (heavy trucks and heavy buses) in 2018 and during the forecast period 2019-2024? ACROSS THE VALUE CHAIN METICULOUS What is the volume and value of intelligent tires and sensors for different types of sales channels in 2018 and during the forecast period 2019-2024? COMPILATION OF MORE THAN 250 RESEARCH HOURS What is the market size of different regions, namely North America, Europe, Asia-Pacific, and Rest-of-the- World (RoW) in 2018 and during the forecast period 2019-2024? EXCLUSIVE INSIGHTS FROM IN-DEPTH EXPERT INTERVIEWS Which are the key companies operating in the automotive intelligent tire and sensors market? CONTAINS 22 MARKET DATA TABLES AND 143 FIGURES SPREAD ACROSS 182 PAGES Which global factors are expected to impact the automotive intelligent tire and sensors market? What are the key market strategies adopted by the automotive tire and sensor market players? sales@bisresearch.com | www.bisresearch.com
Table of Contents SCOPE & RESEARCH METHODOLOGY Drivers Challenges Opportunities Scope of the Report Global Automotive Tire and Sensor Market Research Methodology MARKET DYNAMICS Key Strategies and Development Product Pricing Analysis Market Share Analysis COMPANY PROFILES Bridgestone Corporation COMPETITIVE INSIGHTS Continental AG Patent Analysis Consortium, Association and Regulatory Bodies Supply Chain Analysis Opportunity Matrix Analysis Country Share Analysis Denso Corporation Hankook Tires INDUSTRY ANALYSIS Infineon Technologies AG Michelin ASSUMPTIONS AND LIMITATIONS Nexen Tire Corporation NXP Semiconductors N.V. Assumptions and Limitations for Market Size Calculations Market Overview GLOBAL AUTOMOTIVE INTELLIGENT TIRE AND SENSOR MARKET BY SALES CHANNEL Pirelli & C. S.p.A. Revvo Technologies Inc. OEM Aftermarket Tymtix Technologies GLOBAL AUTOMOTIVE INTELLIGENT TIRE AND SENSOR MARKET BY VEHICLE TYPE Schrader TPMS Solutions The Goodyear Tire & Rubber Co. Passenger Vehicle Commercial Vehicle GLOBAL AUTOMOTIVE INTELLIGENT TIRE AND SENSOR MARKET BY REGION The Yokohama Rubber Company, Limited North America Europe Asia-Pacific Rest-of-the-World (RoW) ZF Friedrichshafen AG Other Emerging Players VIEW COMPLETE TABLE OF CONTENT sales@bisresearch.com | www.bisresearch.com
List of Tables 1. Tire Pressure Monitoring Regulations Globally 2. Annual Fuel Cost of Different Vehicle Types 3. Impact of Market Drivers 4. Impact of Market Challenges 5. Impact of Market Opportunities 6. Product Pricing Analysis 7. Top Ten Companies by Number of Patents Filed 8. Consortium, Association and Regulatory Bodies for Automotive Industry 9. Associations for Automotive Tire Industry 10. Who Supplies Whom for Automotive Tires 11. Who Supplies Whom for TPMS Sensors 12. Global Automotive Intelligent Tire and Sensors Market (by Sales Channel), $Million, 2018-2024 13. Global Automotive OEM Intelligent Tire and Sensors Market, $Million, 2018-2024 14. North America Automotive Intelligent Tire and Sensors Market (by Country), Million Units, 2018-2024 15. North America Automotive Intelligent Tire and Sensors Market (by Country), $Million, 2018-2024 16. Europe Automotive Intelligent Tire and Sensors Market (by Country), Million Units, 2018-2024 17. Europe Automotive Intelligent Tire and Sensors Market (by Country), $Million, 2018-2024 18. Asia-Pacific Automotive Intelligent Tire and Sensors Market (by Country), Million Units, 2018-2024 19. Asia-Pacific Automotive Intelligent Tire and Sensors Market (by Country), $Million, 2018-2024 20. Rest-of-the-World Automotive Intelligent Tire and Sensors Market (by Country), Million Units, 2018-2024 21. Rest-of-the-World Automotive Intelligent Tire and Sensors Market (by Country), $Million, 2018-2024 22. Other Emerging Players in the Automotive Intelligent Tire and Sensor Market sales@bisresearch.com | www.bisresearch.com
List of Figures 1. Global TPMS Regulations 28. Global Automotive Intelligent Tire and Sensor Market, $Billion, 2018-2024 2. Global Passenger Car and Commercial Vehicle Sales Volume, Million Units, 2011-2017 29. Smart Tire Prototypes 3. Major Types of TPMS Sensors 30. Different Sales Channels for the Global Automotive Intelligent Tire and Sensors Market 4. Global Automotive Intelligent Tire and Sensor Market Value, $Million, 2018-2024 31. Global Automotive Intelligent Tire and Sensors Market (by Sales Channel), Million Units, 2018 and 2024 5. Global Automotive Intelligent Tire and Sensor Market Volume, Million Units, 2018-2024 32. Global Automotive OEM Intelligent Tire and Sensors Market Volume, Million Units, 2018-2024 6. Global Automotive Intelligent Tire and Sensor Market, (by Vehicle Type), $Billion, 2018-2024 33. Global Automotive Aftermarket Intelligent Tire and Sensors Market, Million Units, 2018-2024 7. Global Automotive Intelligent Tire and Sensor Market Share, (by Sales Channel), 2018 and 2024 34. Global Automotive Aftermarket Intelligent Tire and Sensors Market Value, $Million, 2018-2024 8. Global Automotive Intelligent Tire and Sensor Market Share, (by Country),$ Billion, 2018 and 2024 35. Different Vehicle Types for the Global Automotive Intelligent Tire and Sensors Market 9. Global Automotive Intelligent Tire and Sensor Market Dynamics 36. Global Automotive Intelligent Tire and Sensors Market (by Vehicle Types), $Million, 2018 and 2024 10. Global Vehicle Production, Million Units, 2010-2017 11. Different Levels of Connectivity in a Vehicle 37. Global Automotive Intelligent Tire and Sensors Market (for Passenger Vehicle), Million Units, 2018- 2024 12. Number of Fatalities by Road Accident in Europe, 2011-2017 13. Share of Key Market Strategies & Developments 38. Global Automotive Intelligent Tire and Sensors Market (for Passenger Vehicle), $Billion, 2018-2024 14. Partnerships/Collaborations/Joint Ventures by Companies 39. Global Automotive Intelligent Tire and Sensors Market (for Commercial Vehicle), Million Units, 2018- 2024 15. New Product Launches by Companies 16. Business Expansion by Companies 40. Global Automotive Intelligent Tire and Sensors Market (for Commercial Vehicle), $Billion, 2018-2024 17. Mergers and Acquisitions by Companies 18. Other Key Developments by Companies 41. Global Automotive Intelligent Tire and Sensors Market – Regional Segmentation 19. Market Share Analysis of Automotive Tire Industry by Shipment for 2018 42. Country-Wise Growth Rate for the Global Automotive Intelligent Tire and Sensor Market 20. Market Share Analysis of TPMS Sensor Industry by Revenue for 2018 43. Global Automotive Intelligent Tire and Sensors Market (by Region), Million Units, 2018-2024 21. Patent Filed by Country 22. Patents Filled and Granted for Automotive Intelligent Tire and Sensor Market, Units, 2000-2018. 44. Global Automotive Intelligent Tire and Sensors Market (by Region), $Billion, 2018-2024 23. Supply Chain Analysis 45. North America Automotive Intelligent Tire and Sensors Market, Million Units, 2018-2024 24. Raw Material Providers and Tire Manufacturers 25. Opportunity Matrix Analysis by Region 46. North America Automotive Intelligent Tire and Sensors Market, $Billion, 2018-2024 26. Country Share Analysis of Automotive Intelligent Tire and Sensor Market 47. The U.S. Automotive Intelligent Tire and Sensors Market, Million Units, 2018-2024 27. Global Automotive Intelligent Tire and Sensor Market, Million Units, 2018-2024 48. The U.S. Automotive Intelligent Tire and Sensors sales@bisresearch.com | www.bisresearch.com
List of Figures Market, $Billion, 2018-2024 70. Japan Automotive Intelligent Tire and Sensors Market, $Billion, 2018-2024 49. Canada Automotive Intelligent Tire and Sensors Market, Million Units, 2018-2024 71. South Korea Automotive Intelligent Tire and Sensors Market, Million Units, 2018-2024 50. Canada Automotive Intelligent Tire and Sensors Market, $Billion, 2018-2024 72. South Korea Automotive Intelligent Tire and Sensors Market, $Billion, 2018-2024 51. Mexico Automotive Intelligent Tire and Sensors Market, Million Units, 2018-2024 73. India Automotive Intelligent Tire and Sensors Market, Million Units, 2018-2024 52. Mexico Automotive Intelligent Tire and Sensors Market, $Billion, 2018-2024 74. India Automotive Intelligent Tire and Sensors Market, $Million, 2018-2024 53. Europe Automotive Intelligent Tire and Sensors Market, Million Units, 2018-2024 75. Rest-of-APAC Automotive Intelligent Tire and Sensors Market, Million Units, 2018-2024 54. Europe Automotive Intelligent Tire and Sensors Market, $Billion, 2018-2024 76. Rest-of-APAC Automotive Intelligent Tire and Sensors Market, $Million, 2018-2024 55. Germany Automotive Intelligent Tire and Sensors Market, Million Units, 2018-2024 77. Rest-of-the-World Automotive Intelligent Tire and Sensors Market, Million Units, 2018-2024 56. Germany Automotive Intelligent Tire and Sensors Market, $Billion, 2018-2024 78. Rest-of-the-World Automotive Intelligent Tire and Sensors Market, $Million, 2018-2024 57. Spain Automotive Intelligent Tire and Sensors Market, Million Units, 2018-2024 79. Latin America Automotive Intelligent Tire and Sensors Market, Million Units, 2018-2024 58. Spain Automotive Intelligent Tire and Sensors Market, $Billion, 2018-2024 80. Latin America Automotive Intelligent Tire and Sensors Market, $Million, 2018-2024 59. France Automotive Intelligent Tire and Sensors Market, Million Units, 2018-2024 81. Middle East and Africa Automotive Intelligent Tire and Sensors Market, Million Units, 2018-2024 60. France Automotive Intelligent Tire and Sensors Market, $Billion, 2018-2024 82. Middle East and Africa Automotive Intelligent Tire and Sensors Market, $Million, 2018-2024 61. The U.K. Automotive Intelligent Tire and Sensors Market, Million Units, 2018-2024 83. Share of Key Company Profiles 62. The U.K. Automotive Intelligent Tire and Sensors Market, $Billion, 2018-2024 84. Figure 8.2: Bridgestone Corporation: Overall Financials, 2016-2018 63. Rest-of-Europe Automotive Intelligent Tire and Sensors Market, Million Units, 2018-2024 85. Figure 8.3: Bridgestone Corporation: Net Revenue (by Business Segment), 2016-2018 64. Rest-of-Europe Automotive Intelligent Tire and Sensors Market, $Billion, 2018-2024 86. Bridgestone Corporation: Net Revenue (by Region), 2016-2018 65. Asia-Pacific Automotive Intelligent Tire and Sensors Market, Million Units, 2018-2024 87. Research and Development: Bridgestone Corporation, $Million, 2016-2018 66. Asia-Pacific Automotive Intelligent Tire and Sensors Market, $Billion, 2018-2024 88. Bridgestone Corporation: SWOT Analysis 89. Continental AG: Overall Financials, 2016-2018 67. China Automotive Intelligent Tire and Sensors Market, Million Units, 2018-2024 90. Continental AG: Net Revenue (by Business Segment), 2016-2018 68. China Automotive Intelligent Tire and Sensors Market, $Billion, 2018-2024 91. Continental AG: Net Revenue (by Region), 2016- 2018 69. Japan Automotive Intelligent Tire and Sensors Market, Million Units, 2018-2024 92. Research and Development: Continental AG, $Billion, 2016-2018 sales@bisresearch.com | www.bisresearch.com
List of Figures 93. Continental AG: SWOT Analysis 119. NXP Semiconductors N.V.: SWOT Analysis 94. Denso Corporation: Overall Financials, 2016-2018 120. Pirelli C. S.p.A.: Overall Financials, 2016-2018 95. Denso Corporation: Net Revenue (by Business Segment), 2016-2018 121. Pirelli C. S.p.A.: Net Revenue (by Business Segment), 2016-2018 96. Denso Corporation: Net Revenue (by Region), 2016-2018 122. Pirelli C. S.p.A.: Net Revenue (by Region), 2015- 2017 97. Research and Development: Denso Corporation, $Billion, 2016-2018 123. Research and Development: Pirelli C. S.p.A., $Million, 2016-2018 98. Denso Corporation: SWOT Analysis 124. Pirelli C. S.p.A.: SWOT Analysis 99. Hankook Tires: Overall Financials, 2016-2018 125. The Goodyear Tire & Rubber Co.: Overall Financials, 2015-2017 100. Hankook Tires: Net Revenue (by Region), 2016-2018 126. The Goodyear Tire & Rubber Co.: Net Revenue (by Business Segment), 2016-2018 101. Research and Development: Hankook Tires, $Million, 2016-2018 127. The Goodyear Tire & Rubber Co.: Net Revenue (by Region), 2015-2017 102. Hankook Tires: SWOT Analysis 128. Research and Development: The Goodyear Tire & Rubber Co., $Million, 2016-2018 103. Infineon Technologies AG: Overall Financials, 2016-2018 129. The Goodyear Tire & Rubber Co.: SWOT Analysis 104. Infineon Technologies AG: Net Revenue (by Business Segment), 2016-2018 130. The Yokohama Rubber Company, Limited: Overall Financials, 2015-2017 105. Infineon Technologies AG: Net Revenue (by Region), 2016-2018 131. The Yokohama Rubber Company, Limited: Net Revenue (by Business Segment), 2016-2018 106. Research and Development: Infineon Technologies AG, $Million, 2016-2018 132. The Yokohama Rubber Company, Limited: Net Revenue (by Region), 2015-2017 107. Infineon Technologies AG: SWOT Analysis 133. Research and Development: The Yokohama Rubber Company, Limited, $Million, 2015-2017 108. Michelin: Overall Financials, 2016-2018 109. Michelin: Net Revenue (by Region), 2016-2018 134. The Yokohama Rubber Company: SWOT Analysis 110. Michelin: Net Revenue (by Region), 2016-2018 135. ZF Friedrichshafen AG: Overall Financials, 2016- 2018 111. Research and Development: ACI Worldwide, Inc., $Million, 2015-2017 136. ZF Friedrichshafen AG: Net Revenue (by Business Segment), 2016-2018 112. Michelin: SWOT Analysis 113. Nexen Tire Corporation: Overall Financials, 2016- 2018 137. ZF Friedrichshafen AG: Net Revenue (by Region), 2016-2018 114. Nexen Tire Corporation: SWOT Analysis 138. Research and Development: ZF Friedrichshafen AG, $Billion, 2016-2018 115. NXP Semiconductors N.V.: Overall Financials, 2016- 2018 139. ZF Friedrichshafen AG: SWOT Analysis 116. NXP Semiconductors N.V.: Net Revenue (by Business Segment), 2016-2018 140. Global Automotive Tire and Sensor Market Scope 141. Top Down and Bottom Up Approach 117. NXP Semiconductors N.V.: Net Revenue (by Region), 2016-2018 142. Global Automotive Tire and Sensor Market Influencing Factors 118. Research and Development: NXP Semiconductors N.V., $Billion, 2016-2018 143. Assumptions and Limitations sales@bisresearch.com | www.bisresearch.com
Research Scope & BIS Methodology 1. Scope of the Report The report constitutes of an extensive study of the automotive tire and sensor market. It includes a thorough analysis of different vehicle types and different sales channels. In addition to this, it focuses on the major driving forces, challenges, and growth opportunities of the automotive tire and sensor market. The major players have been identified on the basis of revenue generation pertaining to automotive tire and sensor market, their geographical presence, and company developments related to components. A detailed company profiling has been done in order to understand the players’ strategic behavior. The automotive tire and sensor market is further explained and analyzed on the basis of region. This segment has been categorized into four regions namely: North America, Europe, Asia-Pacific, and Rest-of-the-World. Moreover, the country analysis has also been done in order to have a clear picture of the automotive tire and sensor market. Different countries based on the vehicle sales, various forms of regional developments (geographic expansion) experienced by the manufacturers, and regulations undertaken by government are some of the factors based on which the countries’ growth rate has been calculated. 2. Global Automotive Tire and Sensor Market Research Methodology The research methodology design adopted for this specific study includes a mix of data collected from primary and secondary research. Both primary sources (in-house experts, industry leaders and market players) and secondary research (a host of paid and unpaid databases) along with analytical tools are employed to build the forecast and predictive models. sales@bisresearch.com | www.bisresearch.com
Research Scope & BIS Methodology Figure 1: Research Methodology List of Tables Scope Definition Research Design Market Study Qualitative Quantitative Primary Interviews/ Secondary Research Top Down and Bottom Up Primary & Secondary Data Report Writing Data Validation Data Analysis Data Collection Primary Data Sources The primary sources involve the industry experts from the automotive tire and sensor industry including the automotive tire manufacturers, tire dealers, and vehicle manufacturers, among others. Respondents such as CEOs, vice presidents, marketing directors, and technology and innovation directors, among others have been interviewed to obtain and verify both qualitative and quantitative aspects of this research study. The key data points taken from primary sources include: Validation and triangulation of all the numbers and graphs. Validation of reports segmentation and key qualitative findings. Understanding the competitive landscape. Current and proposed production values of a particular product by market players. Validation of the numbers of various markets for market type. Percentage split of individual markets for geographical analysis. sales@bisresearch.com | www.bisresearch.com
Research Scope & BIS Methodology Secondary Data Sources This research study involves the usage of extensive secondary research, directories, company websites, and annual reports. It also makes use of databases, such as Hoovers, Bloomberg, Business-week, Organization Internationale des Constructeurs d’Automobiles (OICA), and Factiva, to collect useful and effective information for an extensive, technical, market-oriented, and commercial study of the global market. In addition to the data sources mentioned above, the study has been completed with the help of other data sources and websites such as: nhtsa.gov and bts.gov Secondary research was done in order to obtain crucial information about the industry’s value chain, revenue models, market’s monetary chain, total pool of key players, and the current and potential use cases and applications. The key data points taken from secondary research include: Segmentation breakups, split-ups, and percentage shares. Data for market value. Key industry trends of the top players of the market. Qualitative insights into various aspects of the market, key trends, and emerging areas of innovation. Quantitative data for mathematical and statistical calculations. The main task for a thorough analysis of the global automotive tire and sensor market was to identify the set of underlying factors. In this case, the following figure exhibits the detailed methodology adopted for estimating and forecasting the automotive tire and sensor market: sales@bisresearch.com | www.bisresearch.com
Research Scope & BIS Methodology Figure 2: Data Triangulation List of Tables The following figure exhibits data triangulation considered: BIS Research Internal Repository Key Players Competitive Landscape Opportunities/ Challenges Market Size and Market Share Influencing Factors Market Estimates Geographical Analysis Bis Research Internal Repository DATA TRIANGULATION Primary Sources Secondary Sources Primary Sources Secondary Sources Demand Side Demand Side Annual Reports, SEC Filings and 10K Reports of Key Industrial Players Investor Presentations Company Product Presentations Journals and Magazines Press Releases Paid & Unpaid Databases Automotive Industry Association Reports Organisation Internationale des Constructeurs d’Automobiles (OICA) Reports Interview With: Research Institutes Automotive Service Providers OEMs System Integrators Automotive Consultants Automotive Tire Manufacturers Sensor Software Service Providers Sub-Component Suppliers Distributors REQUEST FOR SAMPLE sales@bisresearch.com | www.bisresearch.com
BIS Research 39111 Paseo Padre PKWY STE 313, Fremont CA 94538-1686, Tel: +1-510-404-8135 Global Delivery Centre Tapasya Corp Heights, Subarea, Sector 126, Noida, NCR-201303 India Tel: +91 120 4261540 / +91 120 4261544 To know more about us, please visit our website: bisresearch.com For other queries contact: sales@bisresearch.com sales@bisresearch.com | www.bisresearch.com sales@bisresearch.com | www.bisresearch.com