Download
1 / 16
160 likes | 219 Views
Countries such as the U.S. and Canada account for the major share of HVACR market in the North America region. Argentina and Brazil currently account for the majority market share in South America primarily due to their hot climate, growing urban population, infrastructure, along with increased construction activities among others.

E N D
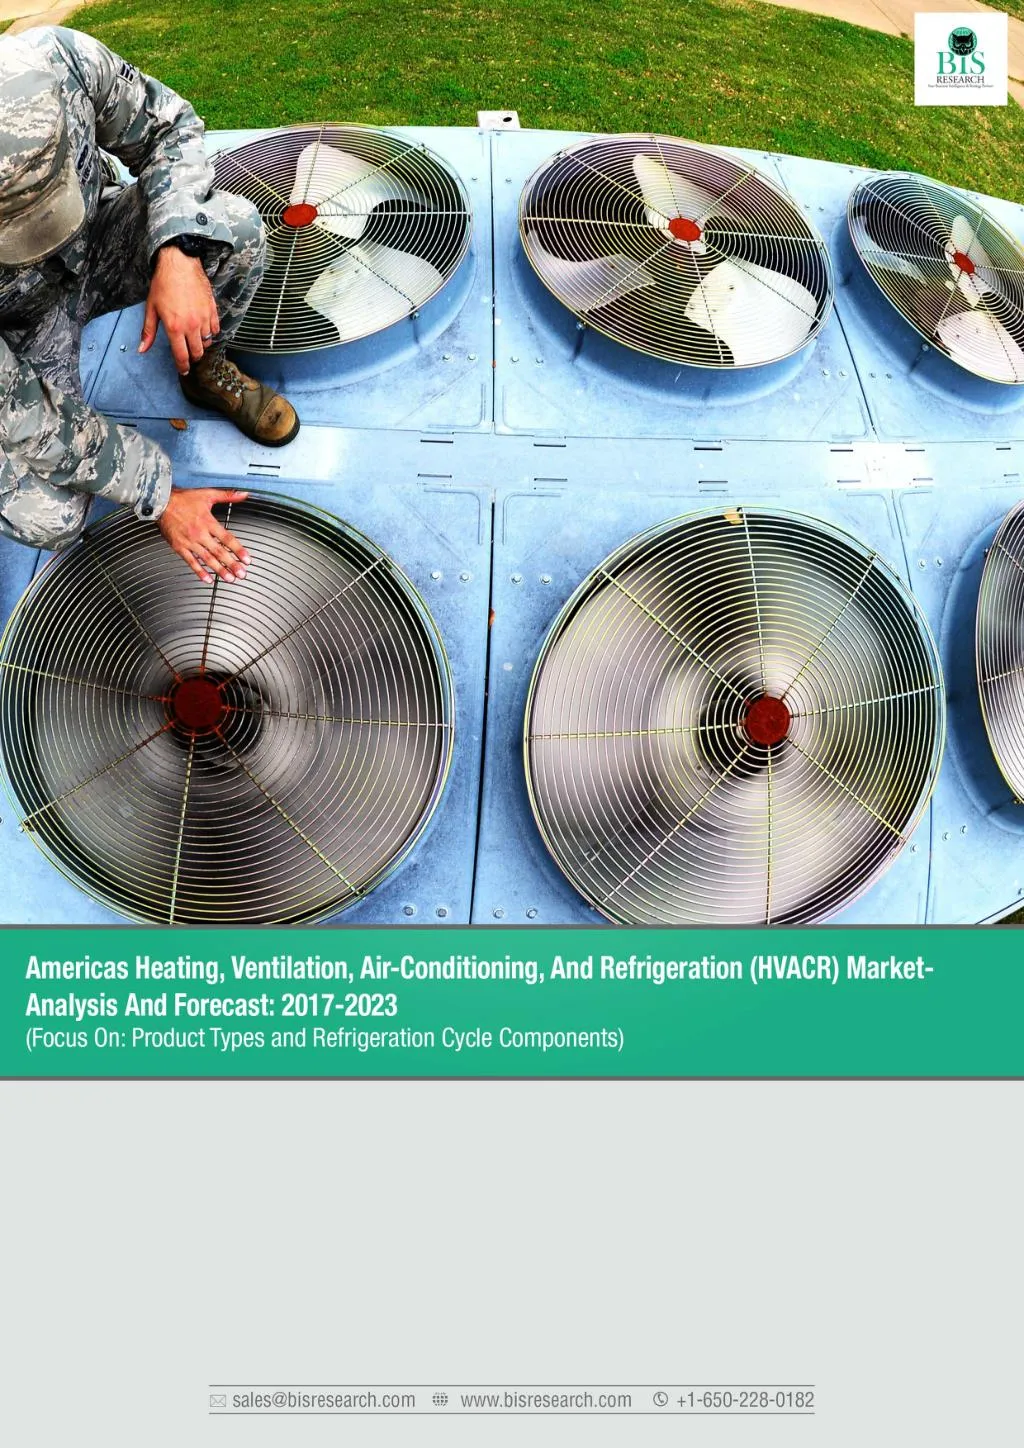
Americas Heating, Ventilation, Air-Conditioning, And Refrigeration (HVACR) Market -Analysis And Forecast: 2017-2023 HVACR systems are gradually becoming more of a necessity rather than mere luxury products in countries across the Americas region. Countries such as the U.S. and Canada accounts for the major share of HVACR market in the North America region. Argentina and Brazil account for the majority market share in South America primarily due to hot climate, growing urban population, infrastructural developments and increased construction activities among others. Per capita income in Americas increased in the recent years which in turn has increased the average disposable income. This has highly been reflected in the residential HVACR market in Americas. Residential market has witnessed significant growth with the increase in the number of unit replacements. The following figure exhibits the Americas HVACR market size (‘000’ units) snapshot: Americas HVACR Market Size (‘000’ units) Snapshot XX XX XX XX XX XX XX XX 2016 2017 2018 2019 2020 2021 2022 2023 BIS Research Analysis In 2016 Americas HVACR market volume was xx thousand units which is forecast to reach a value of xx thousand units by 2023 at a CAGR of xx% from 2017-2023. The demand for HVACR equipment in this region is witnessing a steady growth overall. This growth rate can be attributed to countries such as Brazil, Argentina and Mexico that have shown a huge increase in the demand. North America has had a very steady growth with the U.S. and Canada as the major market share holders. On the other hand, South America had a huge increase in demand which can be attributed to the construction activities, infrastructural developments and economic growth in developing countries such as Brazil and Argentina. Also the entry of Chinese and Japanese OEMs in the market further affected the market favorably. www.bisresearch.com
Americas Heating, Ventilation, Air-Conditioning, And Refrigeration (HVACR) Market -Analysis And Forecast: 2017-2023 The following key questions are answered in the “Americas Heating, Ventilation Air-conditioning and Refrigeration (HVACR) Market, 2017-2023” report: • What are major types of HVACR products prevalent in Americas? • Who are the major players in Americas HVACR market and their respective company profile? • What are the key market developments and strategies of leading players in Americas HVACR market? • What are major drivers, challenges and opportunities for Americas HVACR market? • What is the market size (value and volume) of window and portable/moveable air conditioners in major countries across Americas region? • What is the market size (value and volume) of split systems in different countries across Americas region? • What is the market size (value and volume) of single packed systems in different countries across Americas region? • What is the market size (value and volume) of chillers in Americas HVACR market? • What is the market size (value and volume) of both water–cooled and air-cooled AHU and FCU in different countries across Americas region? • What is the market size (value) of refrigeration cycle components across different products? • What is the market share of top seven HVACR players in the Americas HVACR market along with their trend analysis? www.bisresearch.com
Americas Heating, Ventilation, Air-Conditioning, And Refrigeration (HVACR) Market -Analysis And Forecast: 2017-2023 Analysis & Forecast: Base Year: 2016 Annual Estimated Forecast (2017-2023) Market, By Product Type: Window/Portable, Single Packaged, Chillers, Mini Split Systems, Air Handling Units and Fan Coil Units Market, By Components: Refrigeration Cycle Components (Compressor, Condenser, Evaporator, Expansion Valve and Others) and Supporting Components Market by Countries: North America: U.S., Canada and Mexico South America: Argentina, Brazil and Rest of South America www.bisresearch.com
Americas Heating, Ventilation, Air-Conditioning, And Refrigeration (HVACR) Market -Analysis And Forecast: 2017-2023 TABLE OF CONTENTS 5.3.2 Split Air-conditioners 5.3.3 Single Packaged Units 5.3.4 Chiller 5.3.5 Air Handling Units (AHU) & Fan Coil Units (FCU) 5.4 Americas HVACR Market, by Components 5.4.1 Refrigeration Cycle Components 5.4.1.1 Compressor 5.4.1.2 Condenser 5.4.1.3 Expansion Valve 5.4.1.4 Evaporator 5.4.2 HVACR Supporting Components (PCB’s, Fan Motor and Casing, among others) 5.5 Americas HVACR Market, By Geography 5.5.1 North America 5.5.1.1 U.S. 5.5.1.2 Canada 5.5.1.3 Mexico 5.5.2 South America 5.5.2.1 Argentina 5.5.2.2 Brazil 5.5.2.3 Rest of South America 6 Company Profiles 6.1 Daikin 6.1.1 Company Overview 6.1.2 Financials 6.1.2.1 Financial Summary 6.1.3 SWOT Analysis 6.2 L.G. Corporation 6.2.1 Company Overview 6.2.2 Financials 6.2.2.1 Financial Summary 6.2.3 SWOT Analysis 6.3 Midea Group 6.3.1 Company Overview 6.3.2 Financials 6.3.2.1 Financial Summary 6.3.3 SWOT analysis 6.4 United Technologies Corporation (Carrier) 6.4.1 Company Overview 6.4.2 Carrier Corporation 6.4.3 Financials 6.4.3.1 Financial Summary Executive Summary 1 Research Scope & Methodology 1.1 Scope of the Report 1.2 Americas HVACR Market Research Methodology 2 Market Dynamics 2.1 Introduction 2.2 Market Drivers 2.2.1 Increased Construction activity in Americas 2.2.2 Rapid Urbanisation 2.2.3 Infrastructure Reforms and Increasing HVAC Unit Replacement 2.3 Market Challenges 2.3.1 Rising Demand for Energy 2.3.2 Adherence to Stringent laws and regulations 2.4 Market Opportunities 2.4.1 Introduction of Environment Friendly Refrigerants 2.4.2 Involvement of IoT in HVACR Industry 3 Competitive landscape 3.1 Key Players HVACR Market Share Analysis 3.1.1 Assumptions and Limitations for Market Share Analysis 3.1.2 HVACR Market Share Analysis 3.2 Key Market Developments & Strategies 3.2.1 Product Launch and Development 3.2.2 Collaborations, Joint Ventures & Partnerships 3.2.3 Business Expansion 3.2.4 Mergers and Acquisitions 3.3 Industry Attractiveness 4 Industry Analysis 4.1 Patent Analysis 4.2 Consortium, Association, Acts and Regulatory Bodies 4.3 Value Chain Analysis 5 Americas HVACR Market, Analysis and Forecast 5.1 Assumption for Analysis and Forecast of the Americas HVACR market 5.2 Market Overview 5.3 Americas HVACR Market, by Product Type 5.3.1 Windows and Portable Air-conditioners www.bisresearch.com
Americas Heating, Ventilation, Air-Conditioning, And Refrigeration (HVACR) Market -Analysis And Forecast: 2017-2023 TABLE OF CONTENTS 6.10 Toshiba 6.10.1 Company Overview 6.10.2 Financials 6.10.3 Overall Financials 6.10.3.1 Financial Summary 6.10.4 SWOT Analysis 6.11 Mitsubishi Electric 6.11.1 Overview Table 6.11.2 Financials 6.11.2.1 Financial Summary 6.11.3 SWOT analysis 6.12 Lennox International Inc 6.12.1 Company Overview 6.12.2 Financials 6.12.2.1 Financial Summary 6.12.3 SWOT Analysis 6.9.6 SWOT Analysis 6.5 Samsung 6.5.1 Company Overview 6.5.2 Financials 6.5.2.1 Financial Summary 6.5.3 SWOT Analysis 6.6 Panasonic 6.6.1 Company Overview 6.6.2 Financials 6.6.2.1 Financial Summary 6.6.3 SWOT analysis 6.7 Johnson Controls 6.7.1 Company Overview 6.7.2 Financials 6.7.2.1 Financial Summary 6.7.3 SWOT Analysis 6.8 Ingersoll Rand 6.8.1 Company Overview 6.8.2 Trane 6.8.3 Financials 6.8.3.1 Financial Summary 6.8.4 SWOT Analysis 6.9 Fujitsu 6.9.1 Company Overview 6.9.2 Financials 6.9.3 Overall Financials 6.9.4 Net Revenue by Business Segment 6.9.5 Revenue across Different Geographies 6.9.5.1 Financial Summary 6.4.4 SWOT analysis www.bisresearch.com
Americas Heating, Ventilation, Air-Conditioning, And Refrigeration (HVACR) Market -Analysis And Forecast: 2017-2023 TABLE OF CONTENTS Table 1 Macro-Economic Factors in Americas, 2010–15 Table 2.1 Some of the Major Construction Projects in Americas (2014-2017) Table 2.2 Urban population growth in Americas, 2010 and 2015 Table 2.3 Energy consumption in billion kWh Table 2.4 Refrigerants and their respective ODP & GWP Table 2.5 IoT Developments in HVACR Industry Table 3.1 Product Launches and Developments Table 3.2 Collaborations, Joint Ventures & Contracts Table 3.3 Business Expansion Table 3.4 Mergers and Acquisitions Table 3.5 Buyers and Suppliers in HVACR Americas Market Table 3.6 Key Factors in Determining “Threat from New Entrants” in HVACR Market Americas Region Table 3.7 Key Factors in Determining “Bargaining Power of Buyers” in HVACR Market Americas Region Table 3.8 Key Factors in Determining “Bargaining Power of Suppliers” in HVACR Market Americas Region Table 3.9 Key Factors in Determining “Threat of Substitute Products or Services” in HVACR Market Americas Region Table 3.10 Key Factors in determining “Rivalry among Existing Firms” in HVACR Market Americas region Table 4.1 Patents Filed in the Recent Years (2015-2017) Table 4.2 Consortium, Association, Acts and Regulatory Bodies Table 5.1 North America Windows and Portable Air Conditioners by Volume (2016- 2023) Table 5.2 North America Windows and Portable Air Conditioners by Value (2016- 2023) Table 5.3 South America Windows and Portable Air Conditioners by Volume (2016- 2023) Table 5.4 South America Windows and Portable Air Conditioners by Value (2016- 2023) Table 5.5 North America Split Air Conditioners by Volume (2016-2023) Table 5.6 North America Split Air conditioners by Value (2016-2023) Table 5.7 South America Split Air Conditioners by Volume (2016-2023) Table 5.8 South America Split Air Conditioners by Value (2016-2023) Table 5.9 North America Single Packaged Units by Volume (2016-2023) Table 5.10 North America Single Packaged Units by Value (2016-2023) Table 5.11 South America Single Packaged Units by Volume (2016-2023) Table 5.12 South America Single Packaged Units by Value (2016-2023) Table 5.13 Air Cooled Chillers vs. Water Cooled Chillers Table 5.14 North America Chiller Units by Volume (2016-2023) Table 5.15 North America Chiller Units Conditioners by Value (2016-2023) Table 5.16 South America Chiller Units by Volume (2016-2023) Table 5.17 South America Chiller Units Conditioners by Value (2016-2023) Table 5.18 North America AHU & FCU Units by www.bisresearch.com
Americas Heating, Ventilation, Air-Conditioning, And Refrigeration (HVACR) Market -Analysis And Forecast: 2017-2023 LIST OF TABLE Volume (2016-2023) Cycle Components by Value (2016- 2023) Table 5.37 U.S. Single Packaged Air Conditioners Units by Volume (2016- 2023) Table 5.38 U.S. Single Packaged Units by Value (2016-2023) Table 5.39 U.S. Rooftop Components by Value (2016-2023) Table 5.40 U.S. Rooftop Refrigeration Cycle Components by Value (2016-2023) Table 5.41 U.S. Indoor Components by Value (2016-2023) Table 5.42 U.S. Indoor Refrigeration Cycle Components by Value (2016-2023) Table 5.43 U.S. Chiller Units by Volume (2016- 2023) Table 5.44 U.S. chiller Units by Value (2016- 2023) Table 5.45 U.S. Chiller Components by Value (2016-2023) Table 5.46 U.S. Chiller Refrigeration Cycle Components by Value (2016-2023) Table 5.47 U.S. AHU and FCU Units by Volume (2016-2023) Table 5.48 U.S. AHU an FCU Units by Value (2016-2023) Table 5.49 Canada Windows and Portable Air Conditioners Units by Volume (2016- 2023) Table 5.50 Canada Windows and Portable Air Conditioners Units by Value (2016- 2023) Table 5.51 Canada Windows and Portable Air Conditioners Components by Value (2016-2023) Table 5.52 Canada Windows and Portable Air Conditioners Refrigeration Cycle Components by Value (2016-2023) Table 5.19 North America AHU & FCU Units by Value (2016-2023) Table 5.20 South America AHU & FCU Units by Volume (2016-2023) Table 5.21 South America AHU & FCU Units by Value (2016-2023) Table 5.22 Americas Compressor Component Market Value, by Product Table 5.23 Americas Condenser Component Market Value, by Product Table 5.24 Americas Expansion Valve Component Market Value, by Product Table 5.25 Americas Evaporator Component Market Value, by Product Table 5.26 Americas Supporting Components by Value (2016-2023) Table 5.27 U.S. Windows and Portable Air Conditioners Units Volume (‘000 units), 2016 and 2023 Table 5.28 U.S. Windows and Portable Air Conditioners Units by Value (2016- 2023) Table 5.29 U.S. Windows and Portable Air Conditioners Components by Value (2016-2023) Table 5.30 U.S. Windows and Portable Air Conditioners Refrigeration Cycle Components by Value (2016-2023) Table 5.32 U.S. Mini Splits Air Conditioners Units by Value (2016-2023) Table 5.33 U.S. Mini Splits Ductless Components by Value (2016-2023) Table 5.34 U.S. Ductless Mini Splits Refrigeration Cycle Components by Value (2016-2023) Table 5.35 U.S. Ducted Mini Splits Components by Value (2016-2023) Table 5.36 U.S. Ducted Mini Splits Refrigeration www.bisresearch.com
Americas Heating, Ventilation, Air-Conditioning, And Refrigeration (HVACR) Market -Analysis And Forecast: 2017-2023 LIST OF TABLE Table 5.53 Canada Split Air Conditioners Units by Volume (2016-2023) Table 5.54 Canada Mini Splits Air Conditioners Units by Value (2016-2023) Table 5.55 Canada Mini Splits Ductless Components by Value (2016-2023) Table 5.56 Canada Ductless Mini Splits Refrigeration Cycle Components by Value (2016-2023) Table 5.57 Canada Ducted Mini Splits Components by Value (2016-2023) Table 5.58 Canada Ducted Mini Splits Refrigeration Cycle Components by Value (2016-2023) Table 5.59 Canada Single Packaged Air Conditioners Units by Volume (2016- 2023) Table 5.60 Canada Single Packaged Air Conditioners Units by Value (2016- 2023) Table 5.61 Canada Rooftop Components by Value (2016-2023) Table 5.62 Canada Rooftop Refrigeration Cycle Components by Value (2016-2023) Table 5.63 Canada Indoor Components by Value (2016-2023) Table 5.64 Canada Indoor Refrigeration Cycle Components by Value (2016-2023) Table 5.65 Canada Chiller Units by Volume (2016-2023) Table 5.66 Canada Chiller Units by Value (2016- 2023) Table 5.67 Canada Chiller Components by Value (2016-2023) Table 5.68 Canada Chiller Refrigeration Cycle Components by Value (2016-2023) Table 5.69 Canada AHU and FCU Units by Volume (2016-2023) Table 5.70 Canada AHU an FCU Units by Value (2016-2023) Table 5.71 Mexico Windows and Portable Air Conditioners Units by Volume (2016- 2023) Table 5.72 Mexico Windows and Portable Air Conditioners Units by Value (2016- 2023) Table 5.73 Mexico Windows and Portable Air Conditioners Components by Value (2016-2023) Table 5.74 Mexico Windows and Portable Air Conditioners Refrigeration Cycle Components by Value (2016-2023) Table 5.75 Mexico Split Air Conditioners Units by Volume (2016-2023) Table 5.76 Mexico Mini Splits Air Conditioners Units by Value (2016-2023) Table 5.77 Mexico Mini Splits Ductless Components by Value (2016-2023) Table 5.78 Mexico Ductless Mini Splits Refrigeration Cycle Components by Value (2016-2023) Table 5.79 Mexico Ducted Mini Splits Components by Value (2016-2023) Table 5.80 Mexico Ducted Mini Splits Refrigeration Cycle Components by Value (2016-2023) Table 5.81 Mexico Single Packaged Air Conditioners Units by Volume (2016- 2023) Table 5.82 Mexico Single Packaged Air Conditioners Units by Value (2016- 2023) Table 5.83 Mexico Rooftop Components by Value (2016-2023) Table 5.84 Mexico Rooftop Refrigeration Cycle Components by Value (2016-2023) Table 5.85 Mexico Indoor Components by Value (2016-2023) www.bisresearch.com
Americas Heating, Ventilation, Air-Conditioning, And Refrigeration (HVACR) Market -Analysis And Forecast: 2017-2023 LIST OF TABLE Table 5.86 Mexico Indoor Refrigeration Cycle Components by Value (2016-2023) Table 5.87 Mexico Chiller Units by Volume (2016-2023) Table 5.88 Mexico chiller Units by Value (2016- 2023) Table 5.89 Mexico Chiller Components by Value (2016-2023) Table 5.90 Mexico Chiller Refrigeration Cycle Components by Value (2016-2023) Table 5.91 Mexico AHU and FCU Units by Volume (2016-2023) Table 5.92 Mexico AHU an FCU Units by Value (2016-2023) Table 5.93 Argentina Windows and Portable Air Conditioners Units by Volume (2016- 2023) Table 5.94 Argentina Windows and Portable Air Conditioners Units by Value (2016- 2023) Table 5.95 Argentina Windows and Portable Air Conditioners Components by Value (2016-2023) Table 5.96 Argentina Windows and Portable Air Conditioners Refrigeration Cycle Components by Value (2016-2023) Table 5.97 Argentina Split Air Conditioners Units by Volume (2016-2023) Table 5.98 Argentina Mini Splits Air Conditioners Units by Value (2016-2023) Table 5.99 Argentina Mini Splits Ductless Components by Value (2016-2023) Table 5.100 Argentina Ductless Mini Splits Refrigeration Cycle Components by Value (2016-2023) Table 5.101 Argentina Ducted Mini Splits Components by Value (2016-2023) Table 5.102 Argentina Ducted Mini Splits Refrigeration Cycle Components by Value (2016-2023) Table 5.103 Argentina Single Packaged Air Conditioners Units by Volume (2016-2023) Table 5.104 Argentina Single Packaged Air Conditioners Units by Value (2016- 2023) Table 5.105 Argentina Rooftop Components by Value (2016-2023) Table 5.106 Argentina Rooftop Refrigeration Cycle Components by Value (2016- 2023) Table 5.107 Argentina Indoor Components by Value (2016-2023) Table 5.108 Argentina Indoor Refrigeration Cycle Components by Value (2016- 2023) Table 5.109 Argentina Chiller Units by Volume (2016-2023) Table 5.110 Argentina chiller Units by Value (2016-2023) Table 5.111 Argentina Chiller Components by Value (2016-2023) Table 5.112 Argentina Chiller Refrigeration Cycle Components by Value (2016- 2023) Table 5.113 Argentina AHU and FCU Units by Volume (2016-2023) Table 5.114 Argentina AHU an FCU Units by Value (2016-2023) Table 5.115 Brazil Windows and Portable Air Conditioners Units by Volume (2016-2023) Table 5.116 Brazil Windows and Portable Air Conditioners Units by Value (2016- 2023) Table 5.117 Brazil Windows and Portable Air Conditioners Components by Value (2016-2023) www.bisresearch.com
Americas Heating, Ventilation, Air-Conditioning, And Refrigeration (HVACR) Market -Analysis And Forecast: 2017-2023 LIST OF TABLE Table 5.118 Brazil Windows and Portable Air Conditioners Refrigeration Cycle Components by Value (2016-2023) Table 5.119 Brazil Split Air Conditioners Units by Volume (2016-2023) Table 5.120 Brazil Mini Splits Air Conditioners Units by Value (2016-2023) Table 5.121 Brazil Mini Splits Ductless Components by Value (2016-2023) Table 5.122 Brazil Ductless Mini Splits Refrigeration Cycle Components by Value (2016-2023) Table 5.123 Brazil Ducted Mini Splits Components by Value (2016-2023) Table 5.124 Brazil Ducted Mini Splits Refrigeration Cycle Components by Value (2016-2023) Table 5.125 Brazil Single Packaged Air Conditioners Units by Volume (2016-2023) Table 5.126 Brazil Single Packaged Air Conditioners Units by Value (2016- 2023) Table 5.127 Brazil Rooftop Components by Value (2016-2023) Table 5.128 Brazil Rooftop Refrigeration Cycle Components by Value (2016-2023) Table 5.129 Brazil Indoor Components by Value (2016-2023) Table 5.130 Brazil Indoor Refrigeration Cycle Components by Value (2016-2023) Table 5.131 Brazil Chiller Units by Volume (2016-2023) Table 5.132 Brazil chiller Units by Value (2016- 2023) Table 5.133 Brazil Chiller Components by Value (2016-2023) Table 5.134 Brazil Chiller Refrigeration Cycle Components by Value (2016-2023) Table 5.135 Brazil AHU and FCU Units by Volume (2016-2023) Table 5.136 Brazil AHU an FCU Units by Value (2016-2023) Table 5.137 Rest of South America Windows and Portable Air Conditioners Units by Volume (2016-2023) Table 5.138 Rest of South America Windows and Portable Air Conditioners Units by Value (2016-2023) Table 5.139 Rest of South America Windows and Portable Air Conditioners Components by Value (2016-2023) Table 5.140 Rest of South America Windows and Portable Air Conditioners Refrigeration Cycle Components by Value (2016-2023) Table 5.141 Rest of South America Split Air Conditioners Units by Volume (2016-2023) Table 5.142 Rest of South America Mini Splits Air Conditioners Units by Value (2016-2023) Table 5.143 Rest of South America Mini Splits Ductless Components by Value (2016-2023) Table 5.144 Rest of South America Ductless Mini Splits Refrigeration Cycle Components by Value (2016-2023) Table 5.145 Rest of South America Ducted Mini Splits Components by Value (2016- 2023) Table 5.146 Rest of South America Ducted Mini Splits Refrigeration Cycle Components by Value (2016-2023) Table 5.147 Rest of South America Single Packaged Air Conditioners Units by Volume (2016-2023) www.bisresearch.com
Americas Heating, Ventilation, Air-Conditioning, And Refrigeration (HVACR) Market -Analysis And Forecast: 2017-2023 LIST OF TABLE Table 5.148 Rest of South America Single Packaged Air Conditioners Units by Value (2016-2023) Table 5.149 Rest of South America Rooftop Components by Value (2016-2023) Table 5.150 Rest of South America Rooftop Refrigeration Cycle Components by Value (2016-2023) Table 5.151 Rest of South America Indoor Components by Value (2016-2023) Table 5.152 Rest of South America Indoor Refrigeration Cycle Components by Value (2016-2023) Table 5.153 Rest of South America Chiller Units by Volume (2016-2023) Table 5.154 Rest of South America chiller Units by Value (2016-2023) Table 5.155 Rest of South America Chiller Components by Value (2016-2023) Table 5.156 Rest of South America Chiller Refrigeration Cycle Components by Value (2016-2023) Table 5.157 Rest of South America AHU and FCU Units by Volume (2016-2023) Table 5.158 Rest of South America AHU an FCU Units by Value (2016-2023) www.bisresearch.com
Americas Heating, Ventilation, Air-Conditioning, And Refrigeration (HVACR) Market -Analysis And Forecast: 2017-2023 LIST OF FIGURES Figure 1 Americas HVACR Market Size (‘000’ units) Snapshot Figure 2 Americas HVACR Product Market Size Snapshot Figure 3 Americas HVACR Component Market Size ($Million), 2016-2023 Figure 4 North America HVACR Country Market Snapshot (‘000’ units), 2016-2023 Figure 5 South America HVACR Country Market Snapshot (‘000’ units), 2016-2023 Figure 1.1 Americas HVACR Market Segmentation Figure 1.2 Secondary data sources Figure 1.3 Bottom up Approach Figure 1.4 Americas HVACR Market Influencing Factors Figure 1.5 Assumptions and Limitations Figure 2.1 Market Dynamic Snapshot Figure 2.2 Market Drivers Impact Analysis Figure 2.3 Total construction spending ($Billion), Jan’2016-Jan’2017 Figure 2.4 HVACR unit Replacement rate 1980- 2014 Figure 2.5 Market Challenges Impact Analysis Figure 2.6 Opportunities Impact Analysis Figure 3.1 Competitive Landscape Snapshot Figure 3.2 Market Share Analysis of HVACR Product Manufacturers, by Value (2016) Figure 3.3 Recent Market Development Strategy Snapshot Analysis Figure 3.4 Porter’s Five Forces Analysis for Americas HVACR Equipment Market Figure 4.1 Industry Analysis Snapshot Figure 4.2 Key elements of the Value Chain Figure 4.3 Key Players in Different Elements Figure 5.1 Americas HVACR classification Figure 5.2 Americas Volume (‘000 units), 2016- 2023 Figure 5.3 Americas Value ($Million), 2016- 2023 Figure 5.4 Americas HVACR Product Classification Figure 5.5 Components of a Split Ac Figure 5.6 Outdoor Unit of a Split Air Conditioner Figure 5.7 Indoor Unit of a Split Air Conditioner Figure 5.8 Packaged Air Conditioners Types Figure 5.9 Packaged Air Conditioners with Water Cooled Condenser Figure 5.10 Packaged Air Conditioner with Air Cooled Condenser Figure 5.11 Types of Chillers Figure 5.12 Refrigeration Cycle: Chillers Figure 5.13 Vapour Compression Cycle: Chillers Figure 5.14 Absorption Refrigeration Cycle: Chillers Figure 5.15 Types of Absorption Chillers Figure 5.16 HVACR Components Classification Figure 5.17 Refrigeration Cycle Figure 6.1 Daikin: Overall Financials (2014- 2016) Figure 6.2 Daikin: Revenue by Geography (2014-2016) Figure 6.3 Development Strategies Adopted by the Company in Americas (2014- 2017) Figure 6.4 Daikin: SWOT Analysis Figure 6.5 L.G: Overall Financials (2014-2015) Figure 6.6 L.G: Revenue by Business Segments (2014-2015) Figure 6.7 L.G: Revenue by Geography (2014- 2015) Figure 6.8 Development strategies adopted by the company in Americas (2014- www.bisresearch.com
Americas Heating, Ventilation, Air-Conditioning, And Refrigeration (HVACR) Market -Analysis And Forecast: 2017-2023 LIST OF FIGURES 2017) (2014-2016) Figure 6.9 L.G. Corporation: SWOT Analysis Figure 6.10 Midea: overall financials (2014- 2015) Figure 6.11 Midea: Revenue by Business Segment (2014-2015) Figure 6.12 Midea: Revenue by Geography (2014-2015) Figure 6.13 Development strategies adopted by the company in Americas (2014- 2017) Figure 6.14 Midea: SWOT Analysis Figure 6.15 United Technologies: Overall Financials (2014-2016) Figure 6.16 United Technologies: Revenue by Business Segment (2014-2016) Figure 6.17 United Technologies: Revenue by Geography (2014-2016) Figure 6.18 United Technologies: SWOT Analysis Figure 6.19 Samsung: Overall Financials (2014- 2015) Figure 6.20 Samsung: Revenue by Business Segment (2014-2015) Figure 6.21 Samsung: Revenue by Geography (2014-2015) Figure 6.22 Development Strategies Adopted by the Company in Americas (2014- 2017) Figure 6.23 Samsung: SWOT Analysis Figure 6.24 Panasonic: Overall Financials (2014-2016) Figure 6.25 Panasonic: Revenue by business segment (2014-2016) Figure 6.26 Panasonic: Revenue by Geography (2014-2016) Figure 6.27 Panasonic: SWOT Analysis Figure 6.28 Johnson Controls: Overall Financials Figure 6.29 Johnson Controls: Revenue by Business Segment (2014-2016) Figure 6.30 Johnson Controls: Revenue by Geography (2014-2016) Figure 6.31 Development Strategies Adopted by the Company in Americas (2014- 2017) Figure 6.32 Johnson Controls: SWOT Analysis Figure 6.33 Ingersoll Rand: Overall Financials (2014-2015) Figure 6.34 Ingersoll Rand: Revenue by Business Segment (2014-2015) Figure 6.35 Ingersoll Rand: Revenue by Geography (2014-2015) Figure 6.36 Development Strategies Adopted by the Company in Americas (2014- 2017) Figure 6.37 Ingersoll Rand: SWOT Analysis Figure 6.38 Fujitsu: Overall Financials (2014- 2016) Figure 6.39 Fujitsu: Net Revenue by Business Segment, 2014-2016 Figure 6.40 Fujitsu: Revenue Across Different Geographies, 2014-2016 Figure 6.41 Development Strategies Adopted by the Company in Americas (2014- 2017) Figure 6.42 Fujitsu: SWOT Analysis Figure 6.43 Toshiba: Overall Financials, 2014- 2016 Figure 6.44 Toshiba: Net revenue by Business Segment, 2014-2016 Figure 6.45 Toshiba: Revenue Across Different Geographies, 2014-2016 Figure 6.46 Development Strategies Adopted by the Company in Americas (2014- 2017) www.bisresearch.com
Americas Heating, Ventilation, Air-Conditioning, And Refrigeration (HVACR) Market -Analysis And Forecast: 2017-2023 LIST OF FIGURES Figure 6.47 Toshiba: SWOT Analysis Figure 6.48 Mitsubishi: Overall Financials (2014-2016) Figure 6.49 Mitsubishi: Revenue by Business Segments (2014-2016) Figure 6.51 Development Strategies Adopted by the Company in Americas (2014- 2017) Figure 6.52 Mitsubishi: SWOT Analysis Figure 6.53 Lennox International Inc.: Overall Financials (2014-2016) Figure 6.54 Lennox International: Revenue by Business Segments (2014-2016) Figure 6.55 Lennox International: Revenue by Geography (2014-2016) Figure 6.56 Lennox International: SWOT Analysis www.bisresearch.com
Americas Heating, Ventilation, Air-Conditioning, And Refrigeration (HVACR) Market -Analysis And Forecast: 2017-2023 DISCLAIMER BIS Research provides valuable market intelligence to an exclusive group of customers in response to orders. The report is licensed for the customer’s internal use only and is subject to restrictions set henceforth. This document and its contents are confidential and may not be further distributed, published or reproduced, in whole or in part, by any medium or in any form for any purpose, without the express written consent of BIS Research. Customer will not disclose the contents of the report, whether directly in any media or indirectly through incorporation in a database, marketing list, report or otherwise, or use or permit the use of Information to generate any statistical or other information that is or will be provided to third parties; or voluntarily produce Information in legal proceedings. Market reports are based on expectations, estimates and projections as of the date such information is available. Any recommendation contained in this report may not be suitable for all investors or businesses. The market conclusions drawn are necessarily based upon a number of estimates and assumptions that, while considered reasonable by BIS Research as of the date of such statements, are inherently subject to market fluctuations and business, economic and competitive uncertainties and contingencies. For more details regarding permission, please contact us: Email: sales@bisresearch.com Tel: +1 650 228 0182 www.bisresearch.com