Download
1 / 52
520 likes | 725 Views
Institution of Civil Engineers– October 5 th 2011: Ipswich. The Challenges facing the UK in achieving a sustainable Energy Future. Recipient of James Watt Gold Medal for Energy Conservation. Keith Tovey ( 杜伟贤 ) M.A., PhD, CEng, MICE, CEnv

E N D
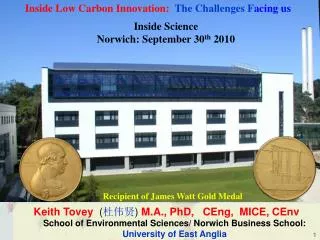
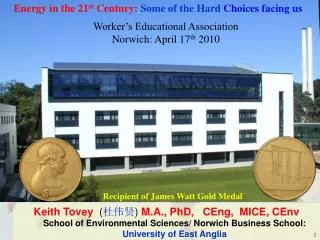
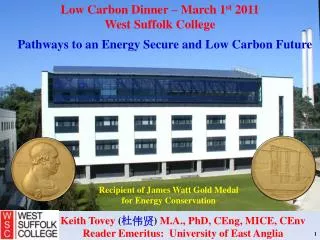
Institution of Civil Engineers– October 5th 2011: Ipswich The Challenges facing the UK in achieving a sustainable Energy Future Recipient of James Watt Gold Medal for Energy Conservation Keith Tovey (杜伟贤)M.A., PhD, CEng, MICE, CEnv Reader Emeritus: University of East Anglia k.tovey@uea.ac.uk Member of ICE Energy Panel
Overview of Presentation • ICE Energy Panel • ICE Energy Panel • Overview of the Three Challenges facing the UK Energy scene. Carbon Reduction, Energy Security and Cost of our Future Energy Supplies • Options for Electricity generation • The Energy Security Questions for 2020 and 2050 • Energy Management and Awareness Issues • Some challenges and opportunities for renewable energy and energy conservation • Conclusions
The Triple Challenges of Carbon Reduction, Energy Security and Cost of our Future Energy Supplies • UK Businesses and Individuals are faced with three challenges associated with Energy Use: • Increasing Evidence of Anthropogenic Climate Change • – and consequential legislation • Issues of Energy Security – particularly in UK • The need to minimise cost exposures to price fluctuations in Energy • These Challenges can be addressed by: • Moving to Low Carbon Energy Supply • Employing Technical Solutions to improve efficiency of End-Use Energy. • Promoting Effective Energy Management and Awareness among users.
Energy Security is a potentially critical issue for the UK Completion of Langeled Gas Line to Norway Import Gap UK becomes net importer of gas Oil reaches $140 a barrel Gas Production and Demand in UK On 7th/8th December 2010: UK Production was only 39%: 12% from storage and 49% from imports Prices have become much more volatile since UK is no longer self sufficient in gas.
What is the magnitude of the CO2 problem? How does UK compare with other countries? Why do some countries emit more CO2 than others? France UK Per capita Carbon Emissions 5
Impact of Electricity Generation on Carbon Emissions. • Transmission/Distribution losses in UK ~ 8-8.5% • In India ~ 20 – 25% Approximate Carbon Emission factors during electricity generation including fuel extraction, fabrication and transport.
Carbon Emissions and Electricity UK France • Coal ~ 900 - 1000 g / kWh • Oil ~ 800 – 900 g/kWh • Gas (CCGT) ~ 400 - 430 kg/kWh • Nuclear ~ 5 – 20 g/kWh 7 Current UK mix ~ 540 g/kWh
Overview of Presentation • ICE Energy Panel • Overview of the Three Challenges facing the UK Energy scene. Carbon Reduction, Energy Security and Cost of our Future Energy Supplies • Options for Electricity generation • The Challenges for 2020 • Energy Management and Awareness Issues • Some challenges and opportunities for renewable energy and energy conservation • Conclusions
Options for Electricity Generation in 2020 - Non-Renewable Methods Nuclear New Build assumes one new station is completed each year after 2020. ? Carbon sequestration either by burying it or using methanolisation to create a new transport fuel will not be available at scale required until mid 2020s so cannot help short term. * Energy Review 2011 – Climate Change Committee May 2009
Options for Electricity Generation in 2020 - Renewable 1.5MW Turbine At peak output provides sufficient electricity for 3000 homes On average has provided electricity for 700 – 850 homes depending on year Future prices from * Renewable Energy Review – 9th May 2011 Climate Change Committee
Options for Electricity Generation in 2020 - Renewable Climate Change Committee (9th May 2011) see offshore wind as being very expensive and recommends reducing planned expansion by 3 GW and increasing onshore wind by same amount Scroby Sands has a Load factor of 28.8% - 30% but nevertheless produced sufficient electricity on average for 2/3rds of demand of houses in Norwich. At Peak time sufficient for all houses in Norwich and Ipswich
Options for Electricity Generation in 2020 - Renewable Micro Hydro Scheme operating on Siphon Principle installed at Itteringham Mill, Norfolk. Rated capacity 5.5 kW Future prices from Climate Change Report (May 2011) or RO/FITs where not otherwise specified
Options for Electricity Generation in 2020 - Renewable Climate Change Report suggests that 1.6 TWh (0.4%) might be achieved by 2020 which is equivalent to ~ 2.0 GW. Future prices from Climate Change Report (May 2011) or RO/FITs where not otherwise specified
Options for Electricity Generation in 2020 - Renewable To provide 5% of UK electricity needs will require an area the size of Norfolk and Suffolk devoted solely to biomass Future prices from Climate Change Report (May 2011) or RO/FITs where not otherwise specified
Options for Electricity Generation in 2020 - Renewable Future prices from Climate Change Report (May 2011) or RO/FITs where not otherwise specified
Options for Electricity Generation in 2020 - Renewable Future prices from Climate Change Report (May 2011) or RO/FITs where not otherwise specified
Options for Electricity Generation in 2020 - Renewable Severn Barrage/ Mersey Barrages have been considered frequently e.g. pre war – 1970s, 2009 Severn Barrage could provide 5-8% of UK electricity needs In Orkney – Churchill Barriers Output ~80 000 GWh per annum - Sufficient for 13500 houses in Orkney but there are only 4000 in Orkney. Controversy in bringing cables south. Would save 40000 tonnes of CO2 Future prices from Climate Change Report (May 2011) or RO/FITs where not otherwise specified
Options for Electricity Generation in 2020 - Renewable Future prices from Climate Change Report (May 2011) or RO/FITs where not otherwise specified
Options for Electricity Generation in 2020 - Renewable Demonstrates importance of on shore wind for next decade or so Future prices from Climate Change Report (May 2011) or RO/FITs where not otherwise specified
Overview of Presentation • ICE Energy Panel • Overview of the Three Challenges facing the UK Energy scene. Carbon Reduction, Energy Security and Cost of our Future Energy Supplies • Options for Electricity generation • The Challenges for 2020 • Energy Management and Awareness Issues • Some challenges and opportunities for renewable energy and energy conservation • Conclusions
Our Choices: They are difficult • Do we want to exploit available renewables i.e onshore/offshore wind and biomass?. • Photovoltaics, tidal, wave are not options for next 10 - 20 years. • [very expensive or technically immature or both] • If our answer is NO • Do we want to see a renewal of nuclear power ? • Are we happy with this and the other attendant risks? • If our answer is NO • Do we want to return to using coal? • then carbon dioxide emissions will rise significantly • unless we can develop carbon sequestration within 10 years UNLIKELY – confirmed by Climate Change Committee • [9th May 2011] If our answer to coal is NO Do we want to leave things are they are and see continued exploitation of gas for both heating and electricity generation? >>>>>>
Our Choices: They are difficult • If our answer is YES • By 2020 • we will be dependent on GAS • for around 70% of our heating and electricity • imported from countries like Russia, Iran, Iraq, Libya, Algeria • Are we happy with this prospect? >>>>>> • If not: • We need even more substantial cuts in energy use. • Or are we prepared to sacrifice our future to effects of Global Warming? - the North Norfolk Coal Field? Do we wish to reconsider our stance on renewables? Inaction or delays in decision making will lead us down the GAS option route and all the attendant Security issues that raises. We must take a coherent integrated approach in our decision making – not merely be against one technology or another
Our looming over-dependence on gas for electricity generation • 1 new nuclear station completed each year after 2020. • 1 new coal station fitted with CCS each year after 2020 • 1 million homes fitted with PV each year from 2020 - 40% of homes fitted by 2030 • 19 GW of onshore wind by 2030 cf 4 GW now Imported Gas UK Gas Offshore Wind Onshore Wind Oil Other Renewables Existing Coal New Coal New Nuclear Existing Nuclear Data for modelling derived from DECC & Climate Change Committee (2011) - allowing for significant deployment of electric vehicles and heat pumps by 2030.
Overview of Presentation • ICE Energy Panel • Overview of the Three Challenges facing the UK Energy scene. Carbon Reduction, Energy Security and Cost of our Future Energy Supplies • Options for Electricity generation • The Challenges for 2020 • Energy Management and Awareness Issues • Some challenges and opportunities for renewable energy and energy conservation • Conclusions
The Behavioural Dimension: Awareness raising Social Attitudes towards energy consumption have a profound effect on actual consumption Data collected from 114 houses in Norwich between mid November 2006 and mid March 2007 For a given size of household electricity consumption for appliances [NOT HEATING or HOT WATER] can vary by as much as 9 times. When income levels are accounted for, variation is still 6 times 26
Performance of ZICER Building 800 350 Good Management has reduced Energy Requirements Space Heating Consumption reduced by 57% CO2 emissions reduced by 17.5 tonnes per annum. 27 27
Electricity Consumption in an Office Building in East Anglia Low Energy Lighting Installed • Consumption rose to nearly double level of early 2005. • Malfunction of Air-conditioning plant. • Extra fuel cost £12 000 per annum ~£1000 to repair fault • Additional CO2 emitted ~ 100 tonnes.
Average Domestic Electricity Consumption in Norfolk and Suffolk • % of average cost of electricity bills compared to National Average • Rank position in UK out of 408 Local Authorities Average house in Norwich emits 1.87 tonnes of CO2 from electricity consumption in Kings Lynn 3.04 tonnes of CO2 (based on UK emission factors) Average household electricity bill in Norwich is 64% that in Kings Lynn
Impact of Electricity Generation on Carbon Emissions. • In 2009 Norfolk and Suffolk was a very low carbon zone in UK • But current accounting procedures do not allow regions to promote this. • A firm in Norfolk / Suffolk would have only 16% of carbon emissions from electricity consumption Approximate Carbon Emission factors during electricity generation including fuel extraction, fabrication and transport.
Existing Renewables Electricity Supply in Norfolk and Suffolk (GWh) • Total generation in Norfolk and Suffolk (allowing for losses) ~ 11000 GWh • Total demand in Norfolk and Suffolk • = 7803 GWh • Net export to remainder of UK ~ 3200 GWh Great Yarmouth Sizewell B At £12.50 per tonne (current EU-ETS price), this represents a benefit of £18 million to rest of UK in carbon saved. Export of Electricity to rest of UK 2009 Data for Renewables and Sizewell Other Data based on typical load factors
Overview of Presentation • ICE Energy Panel • Overview of the Three Challenges facing the UK Energy scene. Carbon Reduction, Energy Security and Cost of our Future Energy Supplies • Options for Electricity generation • The Challenges for 2020 • Energy Management and Awareness Issues • Some challenges and opportunities for renewable energy and energy conservation • Conclusions
Low Carbon Strategies: making efficient use of technology e.g. UEA’s Combined Heat and Power 3 units each generating 1.0 MW electricity and 1.4 MW heat Improved insulation, improved appliance efficiency, (power packs, lighting etc, etc). Energy conserving technologies e.g. heat pumps, CHP etc.
Significant Savings in CO2 emissions are possible with CHP Before installation After installation This represents a 33% saving in carbon dioxide 34
For optimum results: Care in matching demand is needed Load Factor of CHP Plant at UEA • Demand for Heat is low in summer: plant cannot be used effectively. • More electricity could be generated in summer • A Paradox: Largest amount of electricity was imported when demand was least! A 1 MW Adsorption chiller • Uses Waste Heat from CHP • Provides chilling requirements in summer • Reduces electricity demand in summer • Increases electricity generated locally • Saves ~500 tonnes Carbon Dioxide annually.
Low Carbon Strategies: Solar Thermal Solar Thermal solutions can provide hot water • However, performance can be significantly affected by way normal central heating boiler is used for backup. • A factor of two in output has been measured for otherwise identical installations
More Solar Energy is Collected when Hot Water use is greater!!. Sky became hazy at ~ 11:00 Substantial hot water demand at 13:30 Normal heat loss from tank if there had been no demand shown in black 1.157 kWh extra heat collected. Note: further demand at 18:30 leading to further solar collection. Even more solar collection would have been possible had collector been orientated SW rather than S 1.164kWh 0.911kWh 1.157kWh 0.083kWh BS27: 15/05/2004 37
Technical Issues requiring awareness raising: Solar Thermal Energy captured when combined with central heating • Tank with small residual hot water at top of tank in early morning • If Central Heating boiler heats up water – less opportunity for solar heating. Zone heated by solar energy
Technical Issues requiring awareness raising: Tank with small residual hot water at top of tank in early morning No hot water provided by central heating boiler. Gain from solar energy is much higher. More solar energy can be gained if boiler operation is delayed. Boiler ON/OFF times should be adjusted between summer and winter for optimum performance
Solar Rosette Diagram for East Norfolk/Suffolk 0 30 60 90 120 150 180 210 240 270 300 330 360 N NE E SE S SW W NW N Azimuth • Note: • Optimum direction for solar energy in East Anglia is NOT due south but ~ 10-15 degrees West of South. • Reduction for west facing roof is < 20% • For solar thermal a more westerly orientation is often preferable, but depends on hot water use during day
Building Integrated Renewable Electricity Generation - Solar House with both Solar Thermal and Solar PV. ZICER Building, UEA 34 kW • All electricity must be converted from DC to AC by use of inverters. • Inverters are only 92 - 93% efficient • In office buildings much use of electricity is for computers • DC power packs are typically ~70% efficient • Only 2/3rds of costly electricity is used effectively. • An integrated system in a new building would have both a DC and AC network. • Reduced heat gain in building leading to less air-conditioning.
Feed in Tariffs – Introduced 1st April 2010 • Tariffs are index linked each year for existing generators only new generators are affected by revised prices which have still to be confirmed. • Tariffs also available for hydro, anerobic digestion and mini CHP.
Installations under Feed In Tariff Scheme ( to 28/09/2011) The annual output from all schemes installed is ~ 7.5 GWh – the same output as 1.2 modern 3 MW wind turbines such as those at Kessingland.
Renewable Heat Incentive from 01/10/11 for Non-Domestic Installations Stop Press!!! 18:00 on 29th September 2011 The EU have rejected support level for large Biomass and scheme cannot now start until amendments to RHI Order are in place. Tier 1 applies annually up to the Tier Break, Tier 2 above the Tier Break. The Tier Break is: installed capacity x 1,314 peak load hours, i.e.: kWth x 1,314 Temporary Grants for Domestic Installations – implementation 01/10/12
How Variable is Wind Energy? • Wind Energy is often cited as being not predictable. • Data for 23-25th February 2011 from www.bmreports.com • Over 3.7 GW is now visible to National Grid out of 5.4GW. • Predictions are made 48hr and 24 hrs in advance • Generally good correlation with 24hr forecast X-axis shows 30 minute periods from midnight on 23/24th September
How Variable is Wind Energy? Data from BMREPORTS for 2010 Changes in output over 30 minute period Wind Max: 914 MW Min: – 1051 MW StDev : 37.8 MW Nuclear Max: 1630 MW Min: - 877 MW StDev: 39.9MW Data for Sun/Mon 25/26 Sep 2011
Alternative Strategies for Financing • Consumer purchases system and benefits from both reduction in imported electricity and Feed In Tariff – suitable for both domestic and commercial properties for those who are capital rich but income poor. • Company pays for and installs system and claims the Feed In Tariff – the owner of land benefits from reduced energy bills – for those with limited capital and less concerned with income. • Schemes exist for • small wind – e.g. Windcrop who offer 5kW turbines which are less affected by planning issues • Domestic/community PV up to 50kW Images courtesy of WindCrop Honningham Thorpe, Norfolk
Seeking Effective Low Carbon Solutions for Energy Supply • Some costs for providing a low carbon future • Small scale solar PV under the Feed in Tariff • ~ £700+ per tonne CO2 saved • Large Scale On-shore wind under Renewable obligation • ~ £90+ per tonne CO2 saved • Cavity Insulation • ~ <£20 per tonne CO2 saved • Effective Energy Management can often be cost negative in terms of CO2 saved. • An effective strategy will focus on most cost effective solutions.
Conclusions: Strategies for Future Sustainable Energy Supply • Effective Awareness and Energy Management; • Improved Technology to make better use of existing energy; • Low Carbon Energy Supply – including: • Cost effective and technically mature renewables • Nuclear (?) • Carbon Capture and Sequestration – but this will not be available until mid 2020s on scale require. • Only On Shore Wind (??? Some biomass) will be cost effective solutions for renewable energy until at least 2020 • Large Scale Wind is often meeting stiff opposition from planning issues – many of which are red-herrings • Innovative solutions for both financing and minimising planning are an effective way forward • e.g. The approach taken by WindCrop/RENEnergy
Conclusions The UK needs to focus on both the short term (to 2025) and long term (to 2050) in formulating strategies for a low carbon, energy secure future. Legislation affecting Energy use and production in UK • Carbon Reduction Commitment • Renewable Obligation • Feed In Tariffs • Renewable Heat Incentive • Renewable Transport Fuel Obligation • Electricity Market Reform And Finally! "If you do not change direction, you may end up where you are heading." Lao Tzu (604-531 BC) Chinese Artist and Taoist Philosopher This presentation will be available on the WEB from tomorrow at www.cred-uk.org > follow academic links Or http://www2.env.uea.ac.uk/cred/creduea.htm