Download
1 / 22
220 likes | 470 Views
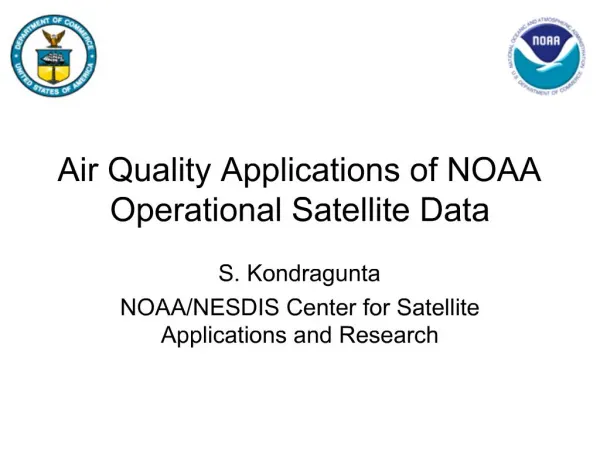
Performance of NOAA-EPA air quality predictions, 2007 - 2009 Jerry Gorline and Pius Lee. Overview of the National Air Quality Forecasting Capability with recent examples. Evaluation of experimental ozone predictions for summer 2007, 2008, 2009.

E N D
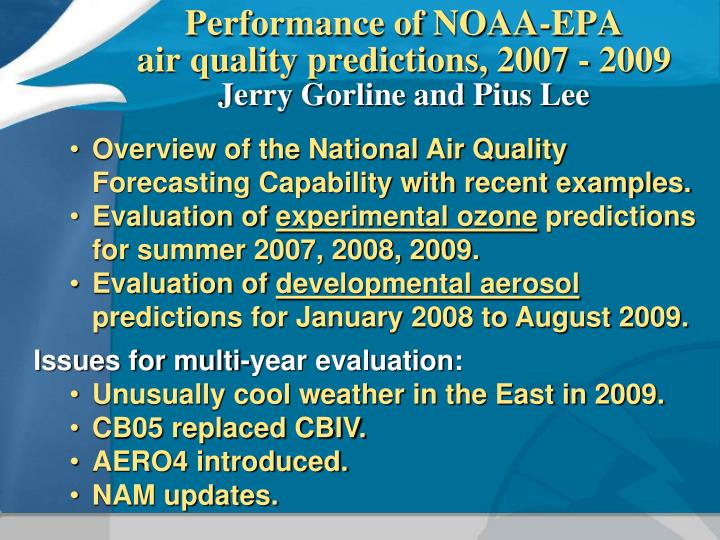
Performance of NOAA-EPA air quality predictions, 2007 - 2009Jerry Gorline and Pius Lee • Overview of the National Air Quality Forecasting Capability with recent examples. • Evaluation of experimental ozone predictions for summer 2007, 2008, 2009. • Evaluation of developmental aerosol predictions for January 2008 to August 2009. • Issues for multi-year evaluation: • Unusually cool weather in the East in 2009. • CB05 replaced CBIV. • AERO4 introduced. • NAM updates.
National Centers for Environmental Prediction (NCEP) - Model predictions (8-h avg ozone, 1-h avg aerosols): Jeff McQueen, Youhua Tang, Marina Tsidulko Environmental Protection Agency (EPA) - Point observations: (ozone: ~1300, aerosols: ~600): Brad Johns, Phil Dickerson, Scott Jackson Air Resources Laboratory (ARL) Daewon Byun, Pius Lee Meteorological Development Laboratory (MDL): Jerry Gorline et al. National Air Quality Forecast Capability (NAQFC) Program Manager: Paula Davidson
National Air Quality Forecast CapabilityCurrent and Planned Capabilities, 10/09 Improving the basis for AQ alerts Providing AQ information for people at risk 2005: O3 2010: O3 AK,HI 6 2007: O3,& smoke 2010: smoke • FY09 Prediction Capabilities: • Operations: Ozone, expanded from EUS to CONUS, 9/07 Smoke implemented over CONUS, 3/07 and AK, 9/09 • Experimentaltesting: • - Ozone upgrades • Smoke predictions over HI in 2009 • Developmentaltesting: • Ozone over AK and HI • - Components for particulate matter (PM) forecasts 2009: smoke • Near-term Operational Targets: • Ozone, smoke coverage extended Nationwide • Higher resolution prediction (4km) • Longer range: • Quantitative PM2.5 prediction • Extend air quality forecast range to 48-72 hours • Include broader range of significant pollutants 3
Other products: Smoke PredictionsStation Fire, California Aug-Sept 2009 • Intense wild-land fire north of LA • 2 fatalities • Smoke impacts closed roads, national parks in CA; extended throughout Southwest US • 8/26- 9/12 (still active; 84% contained) • > 160,000 acres burned
2x2 contingency table definitions Categorical performance metrics: • FC = (a + d)/(a + b + c + d) • TS = a/(a + b + c) Thresholds used: • POD = a/(a + c) ozone: 76 ppb • FAR = b/(a+b) aerosols: 35 ug/m3
Real-time Testing, Summer 2009:Experimental vs Operational O3 at 76 ppb Experimental CB05-based Operational CBIV-based FC lower for experimental predictions
2008ozone activitya + c b c a outbreak Less active in 2009,less under-predictionin June 2009 b c a no outbreaks 2009ozone activitya + c
8-h ozone bias, three-year comparisonAugust 2007, 2008, 2009CONUS, 1200 UTC cycle experimental: slightly higher bias in 2009 2007: CBIV 2008: CB05 2009: CB05
Daily max, 8-h ozone, July 18, 20081200 UTC experimental FC=0.773 TS=0.362 POD=0.766 FAR=0.593 Four-day outbreak of 2008, day 3, 188 observed cases above 76 ppb predicted in dark blue observed as red dots
Daily max, 8-h ozone, July 1, 20091200 UTC experimental FC=0.898 TS=0.341 POD=0.838 FAR=0.635 Most active day of 2009, 68 observed, Performance similar to July 18, 2008 predicted in dark blue observed as red dots
Number of observed values higher than 76 ppb threshold, 1200 UTC experimental8-h ozone, by region Fewer cases in the East in 2009, compared to 2007 and 2008
Threat Score (TS)8-h ozone, by region 2007 to 2009, Th=76 ppb Lower TS in the East in 2009, the unusually cool summer, fewer cases above threshold, may have played a role here.
Seasonal variation of activity8-h ozone vs. 1-h aerosolsJune 2008 to August 2009Theshold: 76 ppb (ozone) 35 ug/m3 (aerosols) Aerosols are active in both winter and summer
Regional monthly bias of aerosolsJan 2008 to Aug 2009, 35 ug/m3 lower bias in winter 2009 compared to winter 2008, except PC region CB05 AERO-4
July 4, 2009Aerosols from fireworks,not in emissions inventory FC=0.600 TS=0.024 POD=0.024 FAR=0.167 under-prediction
Summary: ozone and aerosols • 2008 ozone performance similar to 2007, lower TS in 2009 in the East with fewer observed cases above threshold (unusually cool summer, possibly emission issues, economy?). • Slightly higher and more consistent ozone bias in 2009 (CB05) compared to 2008 (CBIV). • Aerosol over-prediction in cool season (Oct-Mar), under-prediction in warm season (Apr-Sep). • Seasonal aerosol biases smaller in 2009 than in 2008. • Plan to include verification of AK and HI in 2010.
Acknowledgments:AQF Implementation Team Members OST Paula Davidson Program manager OCWWS Jannie Ferrell Outreach, Feedback OCIO Cindy Cromwell, Dan Starosta, Bob Bunge Data Communications OST/MDL Jerry Gorline Dev. Verification OST/MDL Marc Saccucci, Tim Boyer, Dave Ruth NDGD Product Development OST Ken Carey, Ivanka Stajner Program Support NESDIS/NCDC Alan Hall Product Archiving NOAA/OAR Jim Meagher NOAA AQ Matrix Manager NCEP Jeff McQueen, Youhua Tang, Marina Tsidulko, EMC AQF model interface development, testing and integration Jianping Huang, Dongchul Kim *Sarah Lu , Ho-Chun Huang Global data assimilation and feedback testing (NASA, NESDIS) *Brad Ferrier, *Dan Johnson, *Eric Rogers, *Hui-Ya Chuang WRF/NAM coordination Geoff Manikin Smoke Product testing and integration John Ward, Brent Gordon, Chris Magee NCO transition and systems testing Robert Kelly, Bob Bodner, Andrew Orrison HPC coordination and AQF webdrawer * Guest Contributors NOAA/OAR Daewon Byun, Pius Lee, Rick Saylor, Hsin-Mu Lin, CMAQ development, adaptation of AQ simulations for AQF Daniel Tong, Tianfeng Chai, Fantine Ngan Roland Draxler, Glenn Rolph, Ariel Stein HYSPLIT adaptations NOAA/NESDIS Shobha Kondragunta, Jian Zeng Smoke Verification product development Matt Seybold, Mark Ruminski HMS product integration with smoke forecast tool EPA/OAQPS Chet Wayland, Phil Dickerson, Scott Jackson, Brad Johns AIRNow development, coordination with NAQFC EPA/ORD Rohit Mathur, Ken Schere, Jon Pleim, Tanya Otte, CMAQ development, adaptation of AQ simulations for AQF Jeff Young, George Pouliot, Brian Eder, David Wong
Background slideshttp://wwwt.emc.ncep.noaa.gov/mmb/aq/AQChangelogE.html
Fraction Correct (FC), Threat Score (TS)summer 2008 (85 vs. 76 ppb) 1200 UTC cycleOzone: higher TS with lower threshold Red: 85 ppb Blue: 76 ppb
Probability Of Detection (POD) 8-h ozone, 1200 UTC experimental by region, 76 ppb, 2007 to 2009 Higher uncertainty in 2009, too few cases for reliable 95% CI higher uncertainty in 2009 not enough cases > threshold
Number of observed 1-h aerosol cases above 35 ug/m3by region, monthly average PC region more active in winter 2009 compared to winter 2008
NCEP Air Quality Forecast 2009 Verification (1 hr Max ozone vs NAM 2 m Max Temperature) NAM 2m Max Temperature 1 hr daily Max Ozone BIAS West U.S. East U.S. Max temp bias improves slightly by August but ozone errors increased in East U.S.