Download

1 / 28
280 likes | 451 Views
IB Internal Assessment Marking Scheme. IB Environmental Systems and Societies. THE SCIENTIFIC METHOD. “The strongest arguments prove nothing so long as the conclusions are not verified by experience. Experimental science is the queen of sciences and the goal of all speculation.”

E N D
IB Internal Assessment Marking Scheme IB Environmental Systems and Societies
THE SCIENTIFIC METHOD “The strongest arguments prove nothing so long as the conclusions are not verified by experience. Experimental science is the queen of sciences and the goal of all speculation.” Roger Bacon English philosopher/Scientist
It took a long while to determine how is the world better investigated. • Aristotle, the Greek philosopher, stated that males and females have different number of teeth, without bothering to check; • he then provided long arguments as to why this is the way things ought to be. • This method is unreliable: arguments cannot determine whether a statement is correct, this requires PROOF.
“The male has more teeth than the female in mankind, and sheep and goats, and swine. This has not been observed in other animals. Those persons which have the greatest number of teeth are the longest lived; those which have them widely separated, smaller, and more scattered, are generally more short lived.” – Aristotle/ Greek Philosopher From his book – “History of Animals”
A better approach is to do experiments and perform careful observations. The results of this approach are universal in the sense that they can be reproduced by any skeptic. It is from these ideas that the scientific method was developed.
Typical Sequence for the Scientific Method • Observation • Selection of Problem • Derive a Hypothesis / Null Hypothesis • Identify Variables (IV / DV) • Develop a method • Data Collection • Statistical Analysis (REQUIRED FOR MOST LABS) • Interpretation of results and conclusions • Suggestions for improvements
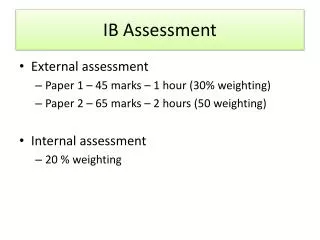
Components of the IA • Each of the following 3 components are evaluated. • Within each component there are 3 aspects. • Each of the 3 aspects are worth a maximum of 2 points each: • 3 x 2 points = 6 points 3 components • Planning (Pl): 6points possible • Data Collection and Processing (DCP) : 6points possible • Discussion, Evaluation and Conclusion (DEC): 6points possible TOTAL POSSIBLE POINTS: 18
Grading Rubric • Complete (2) • Partial (1) • Not at all (0) • Each division of the rubric consists of 3 criteria • Each criteria is worth 0-2 points • Total points possible per division is 6 points
The following component is evaluated once and also has 3 aspects: • Personal Skills (PS) : 6 possible points Two Internal Assessments will be sent away for grading: 18 points per assessment x 2 assessments = 36 points TOTAL IA POSSIBLE POINTS : 36 (Pl, DCP, DEC) + 6(PS) = 42
Selection of Problem • Identify a focused problem or research question. • This should begin with an explanation of the observation that lead to the problem or question. • Your lab write up must have background information that leads up/relates to this problem/question. • This background information needs to come from a reputable source (not Wikipedia) and needs to be cited! With references at the back.
Hypothesis • YOUR CONCLUSION MUST ADDRESS THE HYPOTHESIS YOU ARE GIVING! • Relate the hypothesis directly to the problem / research question. Explain the reason for the hypothesis: • Remember what an educated guess means – don’t forget the educated part. This is why you must explain why you chose the hypothesis. • Example: This is true because….. • THE HYPOTHESIS MUST BE STATED AS “TESTABLE”
Sample Hypotheses • Ifskin cancer is related to ultraviolet light , then people with a high exposure to uv light will have a higher frequency of skin cancer. • Ifleaf color change is related to temperature, then exposing plants to low temperatures will result in changes in leaf color. In the examples above the dependent variable is blue and the independent variable is red.
Selecting Variables • Select the relevant independent, dependent, and controlled variable(s). • State dependent and independent variables • Independent: Manipulated (X axis) • Dependent: Responding (Y axis) • State controlled variables (What must remain the same?) Everything except the IV must remain the same. These “constants” are your controlled variables.
Materials • Selects appropriate materials: BE SPECIFIC as to size, number, etc.
Control Variables • Describe a method to control the variables. DRAW A DIAGRAM WHICH BEST SHOWS THE MAJOR PROTOCOL(S) YOU USED (this could be photographs you have taken. Make sure you show how your control group(s) differ from experimental group(s). • In your procedures you must explain how you are going to control the controlled variables.
Procedure • Write in paragraph form or in list form with complete sentences - use past tenseand the passive voice. • You can use a photograph of your lab setup. Label variables – not just equipment!
Collecting and Recording Raw Data • Must have a RAW DATA TABLE – make sure this is raw data only! (You can make this “neat” later, but keep your raw data table and include it in your laboratory report.) • Make sure that all columns, etc. are properly headed & units are given. • DO NOT SPLIT A DATA TABLE BETWEEN PAGES!! • Uncertainties are mandatory!!! • Drawings: appropriate size and relative position, accuracy • Microscopic drawings: Magnification, size bars, treatment (stain used, smear, sectioned, squashed, whole tissue, maintained at ambient temperature, etc.)
Collecting and Recording Raw Data • Include units and uncertainties. The accepted rule is that the degree of precision is +/- the smallest division on the instrument. Ex: 4.5cm +/- 0.1cm. • Quantitative and/or qualitative data. • Graphic showing resulting condition that may be qualitative.
Data Presentation • Usually a table that is easily understood. • *YOU must design your own data collection method – not group work!
Be careful when recording time! • The best advice is to transform the time value into seconds such as: • 5 minutes and 5 seconds = 5 x 60 = 300 seconds +/- 5 seconds (notice the uncertainty) • Identify Material used: Ex: Ivy leaf or Elodea • Use arrows to identify structures
Data Collection and Processing Data Collection and Processing: A short paragraph section that gives an overview of how and why you decided to process and present the data in the form that shows up later in this section. Sample calculation: neatly lay out and explain one example only, of any type of manipulation that was done to the raw data to help make it more useful for interpretation.
Recording Data • Present raw data clearly. Allow for easy interpretation. • Give careful consideration to the type of graph style(s) you choose! Scatter plots or line graphs are the best choice!! • Include error bars! (standard deviation) • Include appropriate titles for all graphs and data tables • Label the X and Y axis with appropriate units, etc.
Systematically records appropriate quantitative and / or qualitative data including units. • Processes primary and/or secondary data correctly. • Include all formulas used for your calculations • Show calculations • Presents processed data appropriately and effectively to assist analysis.
Qualitative Data • Include tables for qualitative data as well!! • Descriptions of observations / colourchanges/ etc. • Pictures/drawings could be also be used here.
Discussion, evaluation and conclusion • This is a paragraph section in which you get a chance to discuss the results of your experiment. ALWAYS BASED ON DATA! • Start by reviewing and analysing your results. This could be in terms of relevant literature, scientific models and class discussion. • Include identification of trends, patterns and/or anomalies.
Limitations of Experimental Design • This section discusses how well your experimental design helped answer your experimental question. • What worked well (and why) and what did not work well (and why). • Outlier points could be discussed here – with possible reasons for the outliers • If you have error bars on your graph, what do those show? • If you did any statistical tests, what did the results show?
Suggestions for Improvement • In reference to the limitations given in the previous subsection, what realistic and useful improvements could be made if you were to do the experiment again?
Conclusion • Provide a concise and clear conclusion that supports the evidence from the data and your discussion. • Relate this to your hypothesis. • Avoid the use of the word “proof” or “proves” within your discussion, as your data will not prove anything! (supports is a good word choice)