Download
1 / 34
340 likes | 462 Views
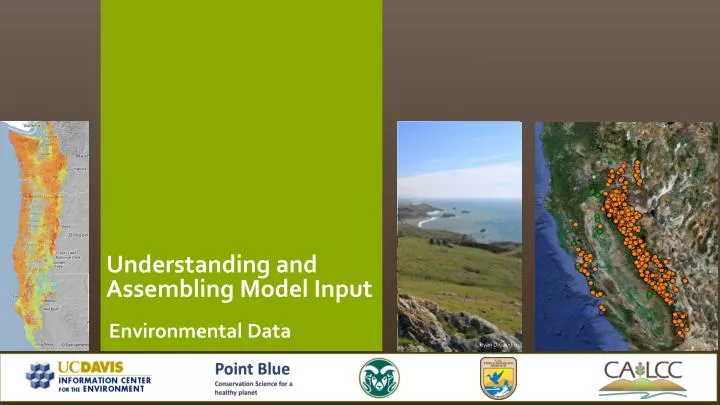
Environmental Data. Understanding and Assembling Model Input. Objectives. By the end of this section, you should be able to: Provide a general definition of environmental data

E N D
Environmental Data Understanding and Assembling Model Input
Objectives • By the end of this section, you should be able to: • Provide a general definition of environmental data • Describe the distinction among the different types of environmental data in relation to modeling species distributions • Describe basic regimes of environmental variables • Describe when it’s important to consider multicollinearity and problems it may cause • Explain the importance of scale when selecting environmental data • Articulate the best practice techniques for environmental variable selection Best Practices for Systematic Conservation Planning
Environmental Data • What are environmental data? • Information about the geographic conditions/features of an area • Examples? • Species Distribution Modeling (SDM) context • Causal, driving forces for a specie’s distribution and abundance • Most often in raster gird format Best Practices For Systematic Conservation Planning
Environmental data • Continuous • Anything you can measure or count • Categorical • Limited number of values or groups • Proximal or distal • The position of the predictor in the chain of processes that link the predictor to its impact on the plant species (Austin 2002) Best Practices for Systematic Conservation Planning
Types of Environmental Data • Direct: Direct physiological influence but are not consumed • Indirect: No physiological effect • Resource: Matter and energy consumed by species Best Practices For Systematic Conservation Planning
Environmental Data Regimes • Climate • Topography • Substrate (geology and soil) • Land cover/ land use • Remote sensing • Biotic interactions • Disturbances Best Practices for Systematic Conservation Planning
Climate Data • Examples • Temperature, precipitation, humidity • Components • Station data • Elevation • Interpolation • Future conditions • Global circulation model (GCM) • Downscaling method • Scenarios • Time period Best Practices for Systematic Conservation Planning
Climate Data • Climate station data Temperature Precipitation Best Practices for Systematic Conservation Planning
Climate Data • Most affected by terrain and water bodies • Current conditions based on averages over many years (1950-2000) • Many local, regional and global sources • Good for applications for model transferability Best Practices For Systematic Conservation Planning
Climate Data: Bioclim • 19 biologically meaningful variables (Hutchinson) • Based off of monthly and annual measures of min temp, max temp, average temp, and precipitation • Heavily used in SDM • Represent • Annual trends • Seasonality • Extremes • Often high collinearity Best Practices for Systematic Conservation Planning
Topography • Earth surface shape and landform features • Digital elevation model (DEM) • Slope and Aspect • Topographic position index • Roughness Jenness, Brost, and Beier, 2011 Best Practices For Systematic Conservation Planning
Substrate • Underlying material on which a process occurs • Can be a strong driver to both plants and animals • Two issues to consider • Factors that proximally determine the species distribution • Link between those factors and the available mapped data • Often coarseunits that may or may not be useful for modeling species distributions U.S. Department of the Interior, U.S. Geological Survey URL: http://pubs.usgs.gov/pp/2004/1686a/1686a.html Best Practices For Systematic Conservation Planning
Land Cover/ Land Use • Physical coverage or type on the earth’s surface • Important to know the intended scale and purpose of the map • Temporal aspect important to consider • National Land Cover Database – 1992, 2001, 2006 Best Practices For Systematic Conservation Planning
Remote Sensing • Satellite collected information of surface reflectance • Many ecologically useful indices can be derived from raw bands • NDVI, Tasseled Cap, Leaf Area Index • Allows for detecting spatial patterns • Can be difficult to calibrate and correct Best Practices For Systematic Conservation Planning
Biotic Interactions • Interspecies interactions that impact species distributions • Distribution of other species • Prey sources • Predators • Competitors • Pollinators • Often assumed that these are accounted for because they co-vary with other variables Global Ecology and BiogeographyVolume 16, Issue 6, pages 754-763, 20 SEP 2007 DOI: 10.1111/j.1466-8238.2007.00345.xhttp://onlinelibrary.wiley.com/doi/10.1111/j.1466-8238.2007.00345.x/full#f2 Best Practices for Systematic Conservation Planning
Disturbances • Changes to the system that may be natural or human-caused • Can be a critical driver of species patterns on a landscape • Temporally dependent • More important at fine scales Lewis, S.A.; Robichaud, P.R.; Hudak, A.T.; Austin, B.; Liebermann, R.J. Utility of Remotely Sensed Imagery for Assessing the Impact of Salvage Logging after Forest Fires. Remote Sens.2012, 4, 2112-2132. Best Practices for Systematic Conservation Planning
Collinearity (a.k.a. multicollinearity) • Environmental variables in a model are linearly related • Always some degree of collinearity • Share the same information in relation to the response being modeled • If not addressed can lead to poor test of variable contribution • Not too important if the only objective is prediction within the sampled range Best Practices for Systematic Conservation Planning
Correlation Matrix Best Practices for Systematic Conservation Planning
Potential Versus Detected Distribution • What's the difference? • Where is it now versus where might it be • Depends on scale and species • Remote sensing environmental data more detection Best Practices for Systematic Conservation Planning
Scale and Environmental Data • Two components of scale • Extent - The geographical area considered • Grain - The smallest measurement unit, the grid cell size • Often default to the available data • Relevant to the species and environment • Large scale = small extent = small geographic area • Small scale = large extent = large geographic area Small scale Large scale 1:10 > 1:1,000 Best Practices for Systematic Conservation Planning
Sample Unit Size ¼ of area 3/4 of area Best Practices for Systematic Conservation Planning
Resampling Nearest Neighbor Bilinear Cubic convolution ? Bilinear interpolation Best Practices for Systematic Conservation Planning
Best Practices for Environmental Variable Selection • Use only n/10 environmental variables • Limited to the data available rather than those most suitable Problem Still biologically relevant? Will they still inform conservation goals? Best Practices for Systematic Conservation Planning
Best Practices for Environmental Variable Selection • If not solely interested in prediction, remove one of each pair of highly correlated environmental variables • Reduce the candidate predictor set using ecological understanding of the species and the system Best Practices for Systematic Conservation Planning
Best Practices for Environmental Variable Selection • Represent resource gradients and other factors that determine a species distribution patterns • Temporal agreement with occurrence records • Direct and resource environmental data are more physiologically ‘mechanistic’ and therefore result in models that are more general Best Practices for Systematic Conservation Planning
Part 4 • How do the file formats between the two layers compare? • What is the extent of the us_tmax_2010.05.tiff and how does this compare to the other rasters? • Check the grain (cell size) of the two layers – any differences? • What about the coordinate reference system between the two layers? Best Practices for Systematic Conservation Planning
Part 4 continue • Once the tool has finished running, check the properties of the output: • Do the number of rows and columns match the other layers? • Is grain size the size the same as the other layers? • Coordinate Reference System? • What might some issues with using this method for resampling? Are we forcing a downscale or upscale of our new raster? • Is there only one way to resample? • What if this was a categorical variable? How would we want to modify our methods to make sure we are using the appropriate resampling methods? Best Practices for Systematic Conservation Planning
Part 5 • Spend some time deciding what variables you would remove and why. Write these down, you will use them later. Best Practices for Systematic Conservation Planning
Part 1 • What is the coordinate reference system of the data? How would you find this out? • How many records don’t have any coordinates? • Are there any duplicate records? • How many records are unique? • What are some field that might help provide a measure of data quality/accuracy • What is the accuracy of a location with a latitude of 31.9 vs. 29.73457? How might this impact any analysis performed with these data • Below is the map of the occurrences. Are there any points the look suspect to further evaluation? Best Practices for Systematic Conservation Planning
Part 2 • These data came from eBird which comprises of data contributed by volunteer and professional • What might be some concerns with this data set? • If you were handed this data set, what would be some questions you would ask to better understand the assumptions and limitations of the data? • Are there any points that look suspicious? • How many occurrences are there? • Are there any duplicate locations? How might this impact a species distribution model? How might two occurrences that have the same location have different environmental data? Best Practices for Systematic Conservation Planning
Part 3 • What do you notice about the distribution of the background points? • Are they a random sample of the environment? • Where are they concentrated? • How is the distribution of the background points similar to the occurrence points? • These points represent all eBrid observations for all other species during the spring months. Why would we want to use these points as our background sample? Best Practices for Systematic Conservation Planning
Part 3 cont. • Take a look at the column names in the background sample spreadsheet. Do the match the original names of the environmental rasters? • Maxent requires the names of the columns in the background file to match the file names of the environmental rasters. What would we need to do to make sure we don’t hit any errors when running Maxent Best Practices for Systematic Conservation Planning