Download
1 / 12
120 likes | 267 Views
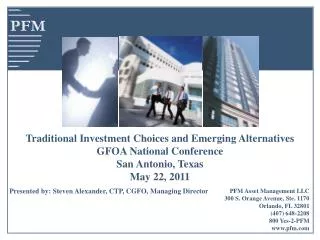
Annual Investment Portfolio Review 2012 Fiscal Year. PFM Asset Management LLC 222 North LaSalle Suite 910 Chicago, IL 60601 www.pfm.com. FY 2012 Core Investment Strategy.

E N D
Annual Investment Portfolio Review 2012 Fiscal Year PFM Asset Management LLC222 North LaSalleSuite 910Chicago, IL 60601www.pfm.com
FY 2012 Core Investment Strategy • Many short-term investment options were hovering near 0.00% and yields continued to stay low through FY 2012 due to the following: • Economic recovery appeared to be slowing • Fed has been keeping interest rates “exceptionally low” for an “extended period” • High unemployment persisted • Impact of high commodity prices was “transitory” • Sovereign problems in Europe • Global economic slowdown • Although interest rates were low, there was a significant penalty for excess liquidity or waiting for rates to increase, so investments were extended , when possible, to add value • The yield curve was still steep, compensating investors for the added interest rate risk; investments in the 2 to 3 year sector were good options compared to alternative short-term choices • Active investment management and higher immediate earnings from longer duration investments will continue to provide protection if rates increase sooner than expected • Going forward, as always, PFM will strive to maintain safety of principal, while seeking opportunities to add value through active management • It should be noted that the CCC’s Working Cash, Short-Term Operating, and OPEB portfolios are performance benchmarked because they are ongoing accounts while the Truman Project and the Capital Improvement Projects portfolios are project oriented accounts that are not performance benchmarked because they have a specified start and end date.
Total Portfolio Breakout • The portfolios are segmented so investments can be more closely matched to expenses OVERALL PORTFOLIO ALLOCATION • As of 6/30/2012
Overall Portfolio Composition Comparison • The sector allocation strategy shifted year-over-year in accordance with the CCC’s investment policy to provide a yield pickup and to enhance performance operations TOTAL SECTOR ALLOCATION • As of 6/30/2012 • As of 6/30/2011
Working Cash Reserve Portfolio (as of 6/30/2012) • Total value: $62,917,161 • Reserve fund portfolio • One-year duration benchmark with 20% maturing in less than one year as per CCC’s investment policy • The portfolio has returned 0.48% for the past fiscal year, exceeding the 1-year Treasury index benchmark by 0.23% (see red box) Total Return Comparison *Notes: Performance on trade date basis, gross (i.e., before fees), in accordance with the CFA Institute’s Global Investment Performance Standards (GIPS). Bank of America / Merrill Lynch Indices provided by Bloomberg Financial Markets. Includes money market fund/cash balances in performance and duration calculations. Quarterly returns are presented on an unannualized basis. Performance numbers for periods greater than 1 year are presented on an annualized basis. * As of June 30, 2012
Short-Term Operating Portfolio (as of 6/30/2012) • Total short-term portfolio value: $85,517,080 plus $74,274,388 in cash and/or money market funds • Portfolio has a 3-month duration and currently meets the needs of CCC’s short-term operating expenses, i.e., payroll, accounts payable, etc. • The portfolio has returned 0.30% for the past fiscal year, exceeding the 3-month Treasury index benchmark by 0.24% (see red box) Total Return Comparison *Notes: Performance on trade date basis, gross (i.e., before fees), in accordance with the CFA Institute’s Global Investment Performance Standards (GIPS). Bank of America / Merrill Lynch Indices provided by Bloomberg Financial Markets. Includes money market fund/cash balances in performance and duration calculations. Quarterly returns are presented on an unannualized basis. Performance numbers for periods greater than 1 year are presented on an annualized basis. * As of June 30, 2012
OPEB “Retiree Fund” Portfolio (as of 6/30/2012) • Total value: $27,831,283 • Funds set aside for Other Post Employment Benefit liabilities, primarily retiree healthcare • Current duration for the benchmark and the portfolio is ~1.8 years • The portfolio has returned 0.86% for the past fiscal year, exceeding the 1 – 3 year Treasury index benchmark by 0.07% (see red box) Total Return Comparison *Notes: Performance on trade date basis, gross (i.e., before fees), in accordance with the CFA Institute’s Global Investment Performance Standards (GIPS). Bank of America / Merrill Lynch Indices provided by Bloomberg Financial Markets. Includes money market fund/cash balances in performance and duration calculations. Quarterly returns are presented on an unannualized basis. Performance numbers for periods greater than 1 year are presented on an annualized basis. * As of June 30, 2012
Capital Improvement Projects Portfolio (as of 6/30/2012) • Total value: $56,543,016 • Funds that have been set aside to support the capital improvement program that the CCC is currently undertaking to benefit all of its students • Current duration for the portfolio is ~1.4 years • The portfolio has returned 0.66% for the past year Total Return Comparison *Notes: Performance on trade date basis, gross (i.e., before fees), in accordance with the CFA Institute’s Global Investment Performance Standards (GIPS). Bank of America / Merrill Lynch Indices provided by Bloomberg Financial Markets. Includes money market fund/cash balances in performance and duration calculations. Quarterly returns are presented on an unannualized basis. Performance numbers for periods greater than 1 year are presented on an annualized basis. * As of June 30, 2012
Recommended Investment Policy Changes • Adding municipal bonds as a permitted investment. Why? • Taxable municipal bonds can offer higher yields and also provide diversification • PFM would only recommend high-quality and highly-rated municipal bonds • They are allowed by the Illinois Public Funds Investment Act • Replaces the declining availability of U.S. Federal Agency securities • There are other Chicagoland governmental entities that allow for municipal bonds in their investment policies, including: the Chicago Housing Authority, the Chicago Park District, Chicago Public Schools, the City of Chicago, Cook County, and the Metropolitan Water Reclamation District of Greater Chicago • Eliminate the requirement of having at least 20% of the Working Cash portfolio mature in less than one year • Removing this restriction will allow for the Working Cash portfolio to be managed longer and will allow for the extension of its duration strategy
Comparison of the CCC Investment Policy with Illinois State Statutes * Recommendation pending to amend the CCC’s investment policy to allow for municipal securities rated tier-3 or higher with a maximum allocation of 25% of the total portfolio
Disclaimer This material is based on information obtained from sources generally believed to be reliable and available to the public, however PFM Asset Management LLC cannot guarantee its accuracy, completeness or suitability. This material is for general information purposes only and is not intended to provide specific advice or a specific recommendation. All statements as to what will or may happen under certain circumstances are based on assumptions, some but not all of which are noted in the presentation. Assumptions may or may not be proven correct as actual events occur, and results may depend on events outside of your or our control. Changes in assumptions may have a material effect on results. Past performance does not necessarily reflect and is not a guaranty of future results. The information contained in this presentation is not an offer to purchase or sell any securities.