Download
1 / 1
10 likes | 71 Views
’. ’. 4. Estimates of storm dew-points for Brisbane. 1. Introduction.

E N D
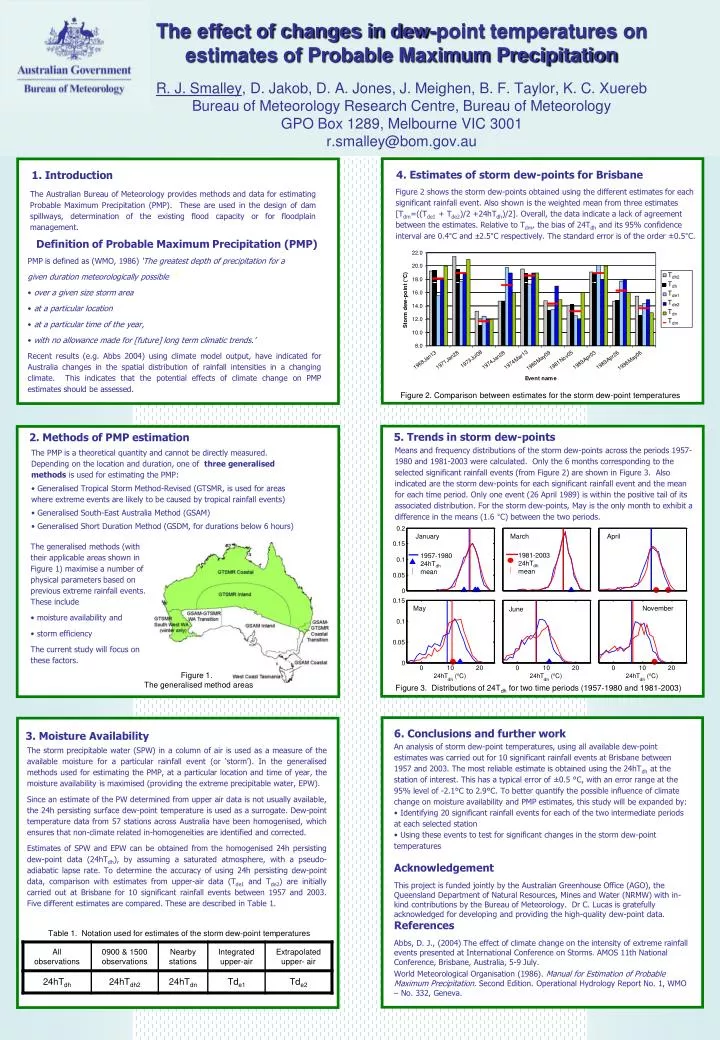
’ ’ 4. Estimates of storm dew-points for Brisbane 1. Introduction Figure 2 shows the storm dew-points obtained using the different estimates for each significant rainfall event. Also shown is the weighted mean from three estimates [Tdm=((Tde1 + Tde2)/2 +24hTdh)/2]. Overall, the data indicate a lack of agreement between the estimates. Relative to Tdm, the bias of 24Tdh and its 95% confidence interval are 0.4°C and ±2.5°C respectively. The standard error is of the order ±0.5°C. The Australian Bureau of Meteorology provides methods and data for estimating Probable Maximum Precipitation (PMP). These are used in the design of dam spillways, determination of the existing flood capacity or for floodplain management. Definition of Probable Maximum Precipitation (PMP) • PMP is defined as (WMO, 1986) ‘The greatest depth of precipitation for a • given duration meteorologically possible • over a given size storm area • at a particular location • at a particular time of the year, • with no allowance made for [future] long term climatic trends.’ • Recent results (e.g. Abbs 2004) using climate model output, have indicated for Australia changes in the spatial distribution of rainfall intensities in a changing climate. This indicates that the potential effects of climate change on PMP estimates should be assessed. Tdh2 Tdh Tde1 Tde2 Tdn Tdm Figure 2. Comparison between estimates for the storm dew-point temperatures 5. Trends in storm dew-points 2. Methods of PMP estimation Means and frequency distributions of the storm dew-points across the periods 1957-1980 and 1981-2003 were calculated. Only the 6 months corresponding to the selected significant rainfall events (from Figure 2) are shown in Figure 3. Also indicated are the storm dew-points for each significant rainfall event and the mean for each time period. Only one event (26 April 1989) is within the positive tail of its associated distribution. For the storm dew-points, May is the only month to exhibit a difference in the means (1.6 °C) between the two periods. • The PMP is a theoretical quantity and cannot be directly measured.Depending on the location and duration, one of three generalised methods is used for estimating the PMP: • Generalised Tropical Storm Method-Revised (GTSMR, is used for areas where extreme events are likely to be caused by tropical rainfall events) • Generalised South-East Australia Method (GSAM) • Generalised Short Duration Method (GSDM, for durations below 6 hours) January March April • The generalised methods (with their applicable areas shown in Figure 1) maximise a number of physical parameters based on previous extreme rainfall events. These include • moisture availability and • storm efficiency • The current study will focus on these factors. 1957-1980 24hTdh mean 1981-2003 24hTdh mean May November June Figure 1. The generalised method areas Figure 3. Distributions of 24Tdh for two time periods (1957-1980 and 1981-2003) • 6. Conclusions and further work • An analysis of storm dew-point temperatures, using all available dew-point estimates was carried out for 10 significant rainfall events at Brisbane between 1957 and 2003. The most reliable estimate is obtained using the 24hTdh at the station of interest. This has a typical error of ±0.5 °C, with an error range at the 95% level of -2.1°C to 2.9°C. To better quantify the possible influence of climate change on moisture availability and PMP estimates, this study will be expanded by: • Identifying 20 significant rainfall events for each of the two intermediate periods at each selected station • Using these events to test for significant changes in the storm dew-point temperatures • Acknowledgement • This project is funded jointly by the Australian Greenhouse Office (AGO), the Queensland Department of Natural Resources, Mines and Water (NRMW) with in-kind contributions by the Bureau of Meteorology. Dr C. Lucas is gratefully acknowledged for developing and providing the high-quality dew-point data. • References • Abbs, D. J., (2004) The effect of climate change on the intensity of extreme rainfall events presented at International Conference on Storms. AMOS 11th National Conference, Brisbane, Australia, 5-9 July. World Meteorological Organisation (1986). Manual for Estimation of Probable Maximum Precipitation. Second Edition. Operational Hydrology Report No. 1, WMO – No. 332, Geneva. The effect of changes in dew-point temperatures on estimates of Probable Maximum PrecipitationR. J. Smalley, D. Jakob, D. A. Jones, J. Meighen, B. F. Taylor, K. C. XuerebBureau of Meteorology Research Centre, Bureau of Meteorology GPO Box 1289, Melbourne VIC 3001r.smalley@bom.gov.au 3. Moisture Availability The storm precipitable water (SPW) in a column of air is used as a measure of the available moisture for a particular rainfall event (or ‘storm’). In the generalised methods used for estimating the PMP, at a particular location and time of year, the moisture availability is maximised (providing the extreme precipitable water, EPW). Since an estimate of the PW determined from upper air data is not usually available, the 24h persisting surface dew-point temperature is used as a surrogate. Dew-point temperature data from 57 stations across Australia have been homogenised, which ensures that non-climate related in-homogeneities are identified and corrected. Estimates of SPW and EPW can be obtained from the homogenised 24h persisting dew-point data (24hTdh), by assuming a saturated atmosphere, with a pseudo-adiabatic lapse rate. To determine the accuracy of using 24h persisting dew-point data, comparison with estimates from upper-air data (Tde1 and Tde2) are initially carried out at Brisbane for 10 significant rainfall events between 1957 and 2003. Five different estimates are compared. These are described in Table 1. Table 1. Notation used for estimates of the storm dew-point temperatures