Download
1 / 39
390 likes | 455 Views
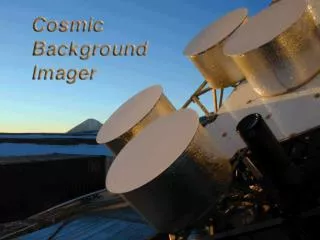
Tracing back the history of galaxies from fossil records (metals, cosmic background,...) and direct measurements (deep surveys, galaxy counts, luminosity funct., cosmic SFR history). Fossil record: stellar diagnostics metals cosmic background

E N D
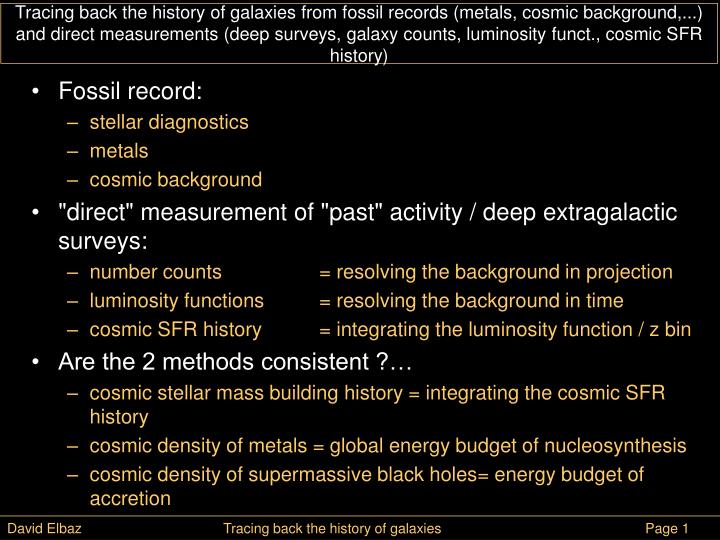
Tracing back the history of galaxies from fossil records (metals, cosmic background,...) and direct measurements (deep surveys, galaxy counts, luminosity funct., cosmic SFR history) • Fossil record: • stellar diagnostics • metals • cosmic background • "direct" measurement of "past" activity / deep extragalactic surveys: • number counts = resolving the background in projection • luminosity functions = resolving the background in time • cosmic SFR history = integrating the luminosity function / z bin • Are the 2 methods consistent ?… • cosmic stellar mass building history = integrating the cosmic SFR history • cosmic density of metals = global energy budget of nucleosynthesis • cosmic density of supermassive black holes= energy budget of accretion David Elbaz Tracing back the history of galaxies Page 1
Deriving a SFR from a luminosity… SFR = C x L(UV) , where C is in M yr-1 L-1 David Elbaz Tracing back the history of galaxies Page 2
SFR vs age, metallicity and extinction… Worthey (1994, ApJS 95, 107) David Elbaz Tracing back the history of galaxies Page 3
SFR vs age, metallicity and extinction… Visible UV Infrared mm dust intensité wavelength Devriendt et al. 99 David Elbaz Tracing back the history of galaxies Page 4
Thomas et al. 05 Braking the age - metallicity degeneracy using supernovae SNIa: O-> Si28-> Ni56-> Co56-> Fe56 SNII = core collapse SN progenitors : >8-10M , lifetime= 3-20 Myr SNIa = thermonuclear explosion of accreting C-O white dwarfs when WD mass Chandra. limit (>1.4 M => > e- degeneracy pressure) progenitors : 3-8M , lifetime= 20-450 Myr David Elbaz Tracing back the history of galaxies Page 5
Braking the age - metallicity degeneracy using supernovae Ferreras & Silk 02 David Elbaz Tracing back the history of galaxies Page 6
Elliptical early-type Spiral (Sa) (with proeminent bulge) H Irregular late-type Spiral (Sc) (with open arms) OII H OIII H H H8 H10 OIII CaIIH&K H9 4000 Å break and Balmer absorption lines David Elbaz Tracing back the history of galaxies Page 7
EW(H) Gyr SDSS data Kauffmann et al 03 4000 Å break and Balmer absorption lines D4000 from accumulation of metallic lines and Balmer absorption lines: break more important with decreasing surface temperature of star (less ionization, more opacity), i.e with increasing age. EW(H) David Elbaz Tracing back the history of galaxies Page 8 Marcillac, Elbaz et al (2006, A&A 458, 369)
(Kauffmann et al. 2003) Red Blue Galaxy bimodality: a clear and mysterious dichotomy between 2 galaxy groups, red-old-dead vs blue-active 4x10¹⁰ M SDSS : 104 °2, North Hem. ugriz, 106 spectra r < 17.77 (Sloan Digital Sky Survey) David Elbaz Tracing back the history of galaxies Page 9
300m 3m 300nm 0.4keV 40keV 4MeV 400MeV 15m (Elbaz et al. 02) CGRB Blazars Hasinger ‘00 David Elbaz Latest news from deep infrared surveys 10
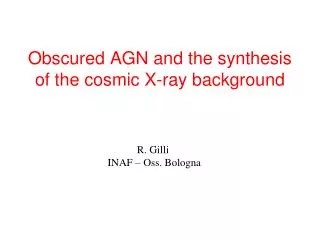
obscured AGNs Compton thin unobscured AGNs Compton Thick AGNs Gilli et al. 300m 3m 300nm 0.4keV 40keV 4MeV 400MeV CGRB Blazars Hasinger ‘00 David Elbaz Latest news from deep infrared surveys 11
Energetic budget Nucleosynthesis get its energy from: p -> He -> C, N, O, Fe… mp= 0.93828 GeV mn= 0.93857 GeV Binding energy from H to He: 7 MeV p -> He: radiates 7MeV per unit 0.93828 GeV -> 0.74 % of mass converted in light for He, then an extra 0.1% for C, N, O, Fe. In practice, ~60% of the metals are in the form of Oxygen (8 MeV), about 7 % in Fe (8.6 MeV), and the rest in C, N mostly (7.5 MeV) Hence globally, 0.84 % of the mass in the form of metals today was radiated (E=Mc2) over the history of the Universe. Globally the budget of nucleosynthesis is such that : Energy radiated = 0.0084 x mass of metals x c2 [ Joules ] per unit time, when dM metals are produced in dt : Luminosity radiated = d [ 0.0084 MZc2 ] / dt David Elbaz Tracing back the history of galaxies Page 12
Energetic budget • When dM metals are produced in dt, the luminosity radiated is: • L = d [ 0.0084 MZc2 ] / dt = 0.0084c2 dMZ/dt [W] • Per unit volume: • L= 0.0084c2 dZ/dt [Wm-3] • Over the history of the Universe, metals have been produced through nucleosynthesis in all stars, leading to an average metal content per unit volume,Z(z~0). • The energy density generated by stars over the history of the Universe is: • L=∫Ldt = 0.0084 Z c2[ J m-3] • On earth, we measure fluxes per unit solid angle in: W m-2 sr-1. • The cosmic background, or extragalactic background light (IGL) is measured in those units, it measures : • the number of photons which have an energy hobserved [ J ] that we collect per unit telescope area [m-2] and per unit time [s-1] over a given solid angle [sr-1]. • Photons arrive to us at a speed of "c" [ms-1], hence when we integrate during "dt", we get all the light contained in a tube of "c dt" length. • Hence, when we observe "d/4" of the sky during "dt", we get: • Lx cdt x d/4or per unit time : Lx c / 4 David Elbaz Tracing back the history of galaxies Page 13
Energetic budget • So : • L=∫Ldt = 0.0084 Z c2[ J m-3] • And when we observe "d/4" of the sky during "dt", we get: • Lx cdt x d/4or per unit time : Lx c / 4 [W m-2 sr-1] But we measure hobserved [ J ] and what was produced is: hemitted hobserved = hemitted / (1+zemitted) So finally, the measured background is: IGL = Lx c / 4/ (1+zem) = 0.0084 Z c3 / [4x (1+zem)] [W m-2 sr-1] Where: Z is the local metal density zem is the redshift at which these metals were produced To know the total amount of light ever produced by stars, we need to determine these two numbers. David Elbaz Tracing back the history of galaxies Page 14
Computation of the local metal density Baryons in the form of stars (+ stellar remnants) make locally: Ωbulges= bulges/c ~ 0.002600 h-1(Fukugita, Hogan, Peebles 1998) Ωdisks= disks/c ~ 0.000860 h-1 Ωirregulars= irregulars/c ~ 0.000069 h-1 where: =/c with ρc = 9.47 x 10⁻²⁷ kg m-3= 3H02/(8G) (H0=71 km s-1Mpc-1 ; G=6.67x10⁻¹¹ m3 kg-1 s-2 ; h=H0/100=0.71) bulges ~ 3.5 x 10⁻²⁹ kg m-3, Zbulges ~2 x Z= 0.04 => bulgesmetals~ 14.0 x 10⁻³¹ kg m-3 disks ~ 1.1 x 10⁻²⁹ kg m-3, Zdisks~1 x Z= 0.02 => diskmetals ~ 2.3 x 10⁻³¹ kg m-3 irregulars~ 0.09 x 10⁻²⁹ kg m-3, Zirregulars ~ 0.02 => irregulmetals ~ 0.2 x 10⁻³¹ kg m-3 => * galaxiesmetals ~ 1.8 x 10⁻³⁰ kg m-3 Intergalactic medium: In galaxy clusters= intra-cluster medium: ΩICM=ICM/c~0.0026 h-1 Where: ZICM=0.3 x Z= 0.006 => ICMmetals ~ 2.1 x 10⁻³¹ kg m-3 In galaxy groups= intra-group medium: Ωgroups= groups/c ~ 0.0056 h-1 Where: ZICM=0.3 x Z= 0.006 => groupsmetals ~ 4.5 x 10⁻³¹ kg m-3 => IGMmetals ~ 0.7 x 10⁻³⁰ kg m-3 => TOTAL: Z~ 2.5 x 10⁻³⁰ kg m-3 David Elbaz Tracing back the history of galaxies Page 15
The local cosmic metal density • From previous considerations, we get: Z = 25 x 10-31 kg m-3 • Calura & Matteucci (2004, MNRAS 350, 351) : Z = 9.37 x 10⁶ M Mpc-3 = 9.37 x 106 x 1.989 x 1030 / (3.0856 x 10²²)3 kg m-3 Z = 6.34 x 10⁻³¹ kg m-3 • Mushotzky & Lowenstein (1997) : Z = 1.4 x 10⁷ M Mpc-3 = 9.5 x 10⁻³¹ kg m-3 • Zepf & Silk (1996) : Z = 4 x 10⁷ M Mpc-3 = 27 x 10-31 kg m-3 • Madau et al. (1996) : Z = 5.4 x 10⁶ M Mpc-3 = 3.7 x 10⁻³¹ kg m-3 • So globally, we get : Z = [4 - 27] x 10-31 kg m-3 David Elbaz Tracing back the history of galaxies Page 16
The integrated galaxy light from nucleosynthesis • So globally, we get : • Z = [4 - 27] x 10-31 kg m-3 • IGL = 0.0084 Z c2 / [4x (1+zem)] [W m-2 sr-1] • = ( Z /10-31 kg m-3) x 1.8 / (1+zem) [nW m-2 sr-1] • IGL = [7 - 49] / (1+zem) [nW m-2 sr-1] • The stellar mass density per unit comoving volume is ~half the present-day one around z~1, so we can assume and average: zem ~ 1 • IGL = 3.5 - 25 [nW m-2 sr-1] • With our estimate, we get: IGL = 25 [nW m-2 sr-1] David Elbaz Tracing back the history of galaxies Page 17
~23 nWm-2sr-1 ~24 nWm-2sr-1 Dole et al (2006) The integrated galaxy light from nucleosynthesis • So globally, we get : IGL = 25 [nW m-2 sr-1]possibly ( 3 - 25 ) This is the good order of magnitude ! A factor 2 below: missing metals ? (extragalactic stars ? IGM ?) Other source of energy ? David Elbaz Tracing back the history of galaxies Page 18
MBH = 1.5x1082004M where200=/200 km s-1 MBH~2x10⁻³ x M*bulge Every galaxy contains a central supermassive black hole Marconi & Hunt Tremaine et al. Gebhardt et al. (2000), Ferrarese & Merritt (2000) c.f. Magorrian (1998) David Elbaz Tracing back the history of galaxies Page 19
Contribution of "Black Holes" to the cosmic background light MBH ~ 2x10⁻³ x M*(bulges) & bulges ~ 3.5 x 10⁻²⁹ kg m-3 BH ~ 7 x 10-32 kg m-3 During the gravitational accretion through which supermassive black hole grow, the gravitational potential energy is converted into light with a given efficiency . Instead of "0.0084 x m" for nucleosynthesis, we have here: " x BH". Typical value generally assumed : ~5-10 % IGLSMBH = x BH c3 / (4x (1+z)) = [7.5 - 15] /(1+z) nW m-2 sr-1 For z~1, we get : IGLSMBH~ 4 - 8 nW m-2 sr-1 To be compared to: IGLnucleosynthesis~ 25 nW m-2 sr-1 On average nucleosynthesis produces 3-5 times more energy than accretion. The observed cosmic background is : EBL ~ 47 nW m-2 sr-1 David Elbaz Tracing back the history of galaxies Page 20
Application to the Milky Way • The total energy radiated by stars in the MW has been : 0.0084 x (ZM*) c2 • Where : Z=0.02 et M*~ 7x10¹⁰M • This energy was radiated over its lifetime : T = 12 Gyr • If the rate of star formation had been constant, we would expect a luminosity of : • L = 0.0084 x (ZM*) c2 / T => L~1.3x10¹⁰L • Observation: • LV(disk)=1.2x10¹⁰L, LB(bulge)=0.25x10¹⁰L => L~1.45x10¹⁰L(Binney & Tremaine) • L(MW)=[3.8±0.6]x1010L(Flynn et al 06) • The present SFR of the MW is : SFR(V.L.)=3.8 ± 2.2 M • (Diehl et al. 2006, Nature 439, 45, radioactive decay of Al26 in photons in supernovae), agrees with OB associations (McKee & Williams 1997, ApJ 476, 144): • If it had been the same over 12 Gyr: M* < SFR x 12Gyr = 4.6x10¹⁰ M • => the SFR the MW was at least ~1.7 times larger in the past to explain its present stellar mass. • Logical since we observe : SFR~gaz1.4 (Schmidt-Kennicutt law) David Elbaz Tracing back the history of galaxies Page 21
IGL EBL Galaxy counts The cosmic background collects the mixed contribution of all galaxies projected on the sky = extragalactic background light (EBL) Deep surveys can spatially resolve the background into individual galaxies contributions = integrated galaxy light (IGL) Differential counts: number of galaxies per flux density interval, i.e. dN/dS. Integral counts: number of galaxies brighter than a given flux density limit, i.e. N(≥S). where: - N= number of galaxies / square armin (steradians) - S = flux density in W m-2 sr-1 (or in apparent magnitude) David Elbaz Tracing back the history of galaxies Page 22
A reference case : Euclidean counts • Basic assumptions: • number of galaxies/unit volume at given luminosity L is: (L)= dN/dL(L) x dL (# Mpc-3) • (L) = luminosity function • sources are homogeneously distributed in euclidean Universe (no expansion) • An image of the sky (survey) with a given depth "Slim" only detects objects closer than : • dlim = (L/4Slim)1/2 • Over the whole sky, the total number of galaxies of luminosity "L" visible in the survey is • N(≥S,L)dL = (L) (4/3) dlim3 = (L) (4/3) dlim3 • Over the solid angle of the survey, one gets : • N(≥S,L)dL = (L) (/3) dlim3 = (L) (/3) (L/4Slim)3/2 • The total number of sources detected in the survey, including all luminosities is: • Hence the euclidean integral counts: N(≥S) ~ S-3/2 • The power "3" comes from the increasing volume with distance -> larger # of galaxies • The power "-1/2" comes from the dilution of flux with increasing distance • The differantial euclidean counts= derivative of N(>S): dN/dS ~ S-5/2 • With apparent magnitudes, one gets : N(≤m) ~ 100.6m David Elbaz Tracing back the history of galaxies Page 23
Euclidean no k-correction Euclidean with k-correction Differential counts at 15 m from ISOCAM Elbaz (2005) David Elbaz Tracing back the history of galaxies Page 24
15 m 24 m 70 m 160m 850m Differential counts in Spitzer passbands Le Borgne, Elbaz, Ocvirck, Pichon 2008 David Elbaz Latest news from deep infrared surveys 25
Differential counts in Spitzer passbands 15 m 24 m 70 m 160m 850m David Elbaz Latest news from deep infrared surveys 26
Differential counts in Spitzer passbands 15 m 24 m 70 m 160m 850m David Elbaz Latest news from deep infrared surveys 27
GOODS-N 24m Origin and interpretation of galaxy number counts Spitzer David Elbaz Latest news from deep infrared surveys 28
Pozzetti & Madau 01 The average sources responsible for the cosmic bkg • In the far IR: z~0.8 , LIR~3x10¹¹ L , SFR ~ 50 M yr-1 • In optical-near IR: z~0.5, mAB~19 , L(0.5 m)~7x10¹⁰ L 50% from z~0.5 David Elbaz Latest news from deep infrared surveys 29
max Luminosity function In comoving volume: necessary to test the evolution of the number density of galaxies (e.g. merging rate) Luminosity function = number of galaxies/unit volume at given luminosity (L)= dN/dL(L) x dL (# Mpc-3) An image of the sky (survey) with a given depth "Slim" only detects objects closer than : dlim = (L/4Slim)1/2 Hence in a limited volume which depends on luminosity: each luminosity bin must therefore be weighted by its associated "maximum volume" = V/Vmax technique The luminosity density is = where Volume = comoving volume 4/3 [ Dm3(z+dz/2) - Dm3(z-dz/2) ] where Dm is the radial comoving distance. David Elbaz Tracing back the history of galaxies Page 30
2 Angular diameter distance, DA, and radial comoving distance, Dm • DA: connects the apparent size of a galaxy, arcseconds, to its physical size, dkpc. dkpc=DA • DM : follows the Universe expansion : Dm=(1+z)DA • c dt = distance travelled by light • x1/R(t) = during dt the Universe expanded (R(t)= scale factor= 1/(1+z) ) • DL: luminosity distance DL=(1+z)Dm=(1+z)2DA , when z is small, DL ≈Dm ≈ DA ≈ cz/H0 • scale factor: R(t)=1/(1+ z) => z=1/R - 1 => dz/dt = - dR/dt /R2 • And the Hubble "constant" is: H= dR/dt / R , hence: dz/dt = - H(z) / R or dt/R= - dz /H(z) • Friedmann equation: comoving volume per square arcmin (or V/4sr-1) and redshift bin (dz) David Elbaz Tracing back the history of galaxies Page 31
2 Comoving volume (Mpc3) / arcmin2 comoving volume per square arcmin (or V/4sr-1) and redshift bin (dz) David Elbaz Tracing back the history of galaxies Page 32
~(L/L*) ~exp-(L/L*) (L) (L)xL/L* Luminosity function Analystical Schechter LF (1976, ApJ 203, 297; 13 galaxy clusters) for local Universe : David Elbaz Tracing back the history of galaxies Page 33
≈ *L* Total luminosity density ≈[-0.9,-1.16] => +2)≈0.84)≈1 => Ltot≈ *L* where 0.0153h3Mpc-3 h=H0/100 ≈ 0.7 => 0.00525 Mpc-3 1 galaxy/190Mpc3, i.e. /6 Mpc on a side and L*≈ 1.4 x 10¹⁰ L(~MW) so : Ltot = L* ≈ 7.3x10⁷LMpc-3 David Elbaz Tracing back the history of galaxies Page 34
Sanders & Mirabel (1996, ARAA 34, 749) Bolometric luminosity function LIR=L(8-1000m) "luminous IR galaxies" (LIRGs) : 11≤log(LIR/L)<12 "ultra-luminous IR galaxies" (ULIRGs) : 12≤log(LIR/L)<13 "hyper-luminous IR galaxies" (HyLIRGs) : 13≤log(LIR/L) David Elbaz Tracing back the history of galaxies Page 35
The cosmic SFR history derived from the UV light Madau et al (1996) Metal production Star production Madau et al (1996) Lilly et al (1996) David Elbaz Tracing back the history of galaxies Page 36
>200Myr-1 >20Myr-1 43% 24% 16% of Universe age 23% 13% of local * density 50% Cosmic history of star formation David Elbaz Latest news from deep infrared surveys 37
Density of AGNs (Wall et al 05) 43% 24% 16% of Universe age 23% 13% of local * density 50% Cosmic history of star formation David Elbaz Latest news from deep infrared surveys 38
Tracing back the history of galaxies from fossil records (metals, cosmic background,...) and direct measurements (deep surveys, galaxy counts, luminosity funct., cosmic SFR history) • Fossil record: • stellar diagnostics • metals • cosmic background • "direct" measurement of "past" activity / deep extragalactic surveys: • number counts = resolving the background in projection • luminosity functions = resolving the background in time • cosmic SFR history = integrating the luminosity function / z bin • Are the 2 methods consistent ?… • cosmic stellar mass building history = integrating the cosmic SFR history • cosmic density of metals = global energy budget of nucleosynthesis • cosmic density of supermassive black holes= energy budget of accretion David Elbaz Tracing back the history of galaxies Page 39