Download
1 / 25
250 likes | 356 Views
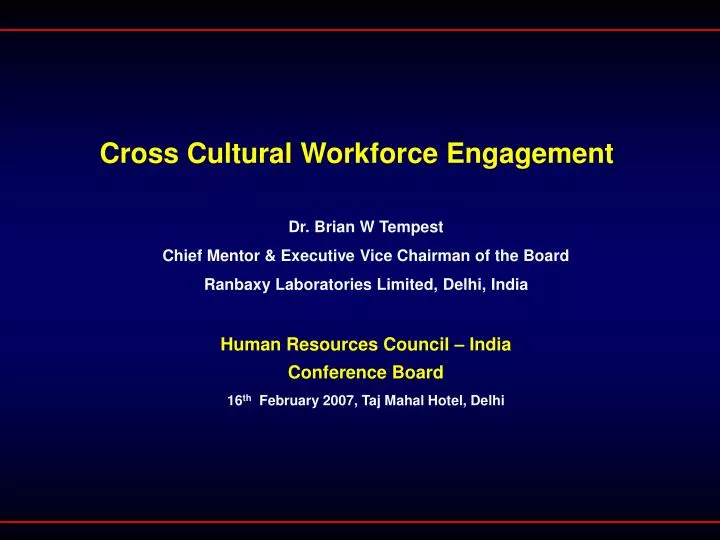
Cross Cultural Workforce Engagement. Dr. Brian W Tempest Chief Mentor & Executive Vice Chairman of the Board Ranbaxy Laboratories Limited, Delhi, India Human Resources Council – India Conference Board 16 th February 2007, Taj Mahal Hotel, Delhi.

E N D
Cross Cultural Workforce Engagement Dr. Brian W Tempest Chief Mentor & Executive Vice Chairman of the Board Ranbaxy Laboratories Limited, Delhi, India Human Resources Council – IndiaConference Board 16th February 2007, Taj Mahal Hotel, Delhi
Except for the historical information contained herein, statements in this presentation and the subsequent discussions, which include words or phrases such as “will”, “aim”, “will likely result”, “would”, “believe”, “may”, “expect”, “will continue”, “anticipate”, “estimate”, “intend”, “plan”, “contemplate”, “seek to”, “future”, “objective”, “goal”, “likely”, “project”, “should”, “potential”, “will pursue” and similar expressions or variations of such expressions may constitute "forward-looking statements". These forward-looking statements involve a number of risks, uncertainties and other factors that could cause actual results to differ materially from those suggested by the forward-looking statements. These risks and uncertainties include, but are not limited to our ability to successfully implement our strategy, our growth and expansion plans, obtain regulatory approvals, our provisioning policies, technological changes, investment and business income, cash flow projections, our exposure to market risks as well as other risks. Ranbaxy does not undertake any obligation to update forward-looking statements to reflect events or circumstances after the date thereof. Disclaimer
Economic Background Global Major Issues - USA on the verge of a military defeat - Iran and N.Korea are global nuclear issues - Shifting power in the Economic world - Religious turmoil in the Islamic world - Inspite of these, the world economy steadily growing, driven by: - Technology innovation - Collapse in cost of collecting, analysing & transmitting information - China/India growth - Integration of global market for goods & services - Monetary stability Source: FT, 10th Jan’2007
Where is the World’s Wealth? Switzerland 1% Spain 1% Netherlands 2% Taiwan 1% Canada 2% Rest of World 10% Germany 4% Italy 4% France 5% USA 37% UK 6% Japan 27% Source: The World Distribution of Household Wealth
Where are the Worlds’ Pharmaceuticals sold? 1.5% 1.5% 2.0% 2.4% 3.3% 3.4% 4.9% 5.4% 12.0% 44.6% Top 15 countries = 85.9% of worldwide pharmaceutical market estimate 2003
Global speed of change • The world is changing faster than ever • Globalisation is the key driver of this change • Best hope for the improvement of the lives of the world’s population • Creates wealth • Faster Trade and interdependence • Over the last 2 decade, more people have been lifted out of poverty in Asia than in any other region at any other time in history • Rise of China & India has energised Asia • Education is highly valued in India & Asia
Science Education in EU “This means that when pupils are in a science laboratory their experience is unsafe, unsatisfactory or uninspiring for 65% of the time.” Source: Royal Society of Chemistry, Policy Bulletin – Spring 2006 UK “A” Level entries: Closed UK University 2000 2005% changeChemistry Departments: Physics : 32,059 28,119 -12% Dundee Kings Chemistry: 40,856 38,851 -5% Surrey Exeter Maths: 67,036 52,897 -21% Lancaster Queen Mary Computing: 19,099 7,242 -62% Source: Daily Mail – 11 August 2006 Only pupils at private schools can take physics, chemistry & biology separately Source: Times, 9th November 2006
Science Education in India Number of Higher Education Institutions 05/06 18,123 +59% 00/01 11,412 90/01 5,932 80/01 4,861 Source: Indian University Grants Commission Number of Students enrolled in Higher Education Institutions 05/06 10,500 +40% 00/01 7,500 90/01 4,000 80/01 3,000 Source: Indian University Grants Commission Number of Institutions courses 05/06 99/00 Pharmacy 1478 669 +120% Medicine 229 174 +32% Physiotherapy 205 52 +294% Source: Pavan Agarwal (2006) based on data from professional councils PhD Degree awarded in Science 03/04 5408 +44% 00/01 3734 90/01 2950 (USA 03/04 25,000) Source: Indian University Grants Committee
The Education Advantage Engineers/Science graduates p.a – India 0.7m, China 0.5m, EU 0.5m, USA 0.4m, Japan 0.3m
The R&D Investment Advantage Most attractive R&D Investment locations: Ranked 3rd - China, USA, India, Japan & UK Source – UNCTAD 2005 Reasons why India: • Qualified Scientists & Engineers • Global India players with Alliances • English speaking • TRIPs compliant – first patent March 2006 • IIT, IIM & other scientific institutions Source – UNCTAD 2005
The Pharma Advantage – API’s USA DMF filings by India % Share of USA DMF filings IndiaChina 2004 27% 9% 2005 37% 10% Q1’06 44% 15% Q2’06 41% 16% Q3’06 45% 17% (latest) Source: US FDA / J P Morgan, 6th August 2006 1990 1 1995 4 2000 36 2004 187 2005 262 Source: Crisil / US FDA / J P Morgan Source: US FDA, Credit Suisse
The Pharma Advantage - ANDAs - One in every four ANDAs filed by Indian Companies in top USA FDA filers Source: KPMG - No Chinese generic company has yet filed a USA FDA ANDA ANDA Filings in USA by Indian Companies 144 64 46 24
Global Market Trends for Generic Companies Source: UBS, Businessworld, 30th October 2006
The Tempest Crystal Ball - Pharma • Post TRIPsnew pharma products will dry up in India by 2008 • Under this pressure Indian Pharma companies will adopt different business models: • - Generics, Discovery, Services, M&A • MNCs will continue to be attracted to India owing to the science education • China will be perceived to be stronger in biology/ toxicology • 75% of new R&D sites and 30% of R&D staff globally will be in India/China • Alliances between Western Biotech and Indian companies will expand • The global generic industry will be dominated by India in the next five years • China will dominate the chemical intermediates segment • It will be India & China - and not India or China
Our Cultural diversity • Country HeadcountNo. of Countries • <10 24 • 10-25 4 • 25-50 4 • 50-100 7 • >100 10* • Ground operations in 49 countries • 1/3 of headcount overall is non Indian • *Brazil, Romania, Malaysia, China, Russia, South Africa, Nigeria, Japan • US, India
Cultural Diversity is driven by M&A 2003 – 2007 M&A deals in Europe Ranbaxy - 6 Stada - 2 Matrix - 2 DRL - 1 Aurobindo - 1 Wockhardt - 3 Sun Pharma - 1 Torrent - 1 Jubilant - 1 Zydus Cadilla - 1 Source: Nomura, 21st December 2006
Potential for human disconnections Americans- very aggressive - must be clear, start early, finish early Chinese - bargain very aggressively Italians - possessive about their personal time, don’t expect to meet outside office hours & Australians or weekends Brazilians - love football, fast cars & coffee Canadians - a mixture of Americans and Europeans Scandinavians- don’t appreciate jokes so much Spanish - unusual long lunch hours is the norm French - want to shake hands every morning and may even kiss you Koreans - hardly stop working, but when they do, drink lots of whisky Arabs - a long pre-dinner reception, but the last piece of food ends the meeting Japanese - slow in decision making, very hierarchial, large teams patience needed
Both Japan & India are hungry for Information Internet Usage – Asia Mobile Phones • China 123 m • Japan 86 m • India 51 m • S.Korea 34 m • Source: Business Today, Sept. 24, 2006 • China 421 m • 2. USA 190 m • Japan 157 m • Russia 148 m • 5. India 116 m • Source: Times of India, Sept. 14, 2006
Japanese – India vs engagement • Before time vs After time • White shirts/tiesvsOpen neck shirt • Sashime vs Vegetarianism • Golf vs Cricket • Takes time for each side to understand what is a very complex picture, eg. visiting cards, hellos • Japanese are heavily influenced by USA, Technology Innovation, Education & Productivity
The Productivity Advantage India a usa Pharma view USA 1 chemist Better education x 1.3 1 chemist 70 hours/week Longer working time x 1.3 50 hours/week $ 800 monthly Lower cost x 20 $ 12,000 monthly Sources: IPHMR Conferences, New Delhi August 2004
Assessment Centre results on 200 managers • Some brilliant minds with perfect scores • Mathematics are very strong • Great achievers & deliverers of results • Weaker in the softer skills, eg. persuasion & motivation • Team building skills need enhancing • Invest in training
Conclusions • Senior managers need to be chameleons • Management teams should represent a mixture of culture • HR team needs a mixture of cultures • Communications is the most important step • Operate seamlessly in different countries • Sensitive to local culture & traditions • Avoid the expat India clique • Invest in training, transfers, team, travel Source: R.Gopalakrishnan – Asian Management Review, April 2006