Download
1 / 6
70 likes | 371 Views
Spatial Inequality. Corinne Paige Kate Leticia. Explain the spatial and ecological dimensions of the issue.

E N D
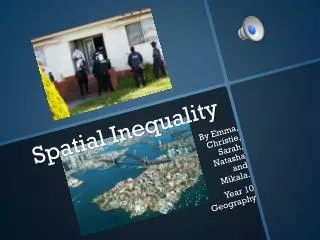
Spatial Inequality Corinne Paige Kate Leticia
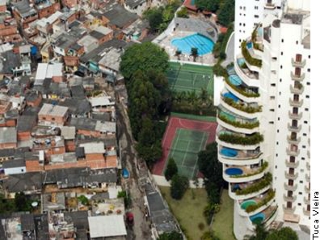
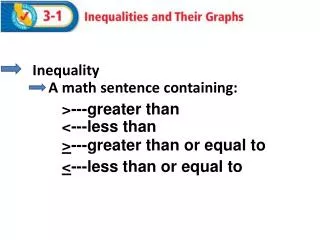
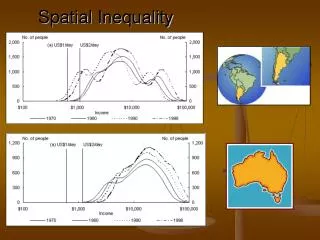
Explain the spatial and ecological dimensions of the issue Spatial inequality is the unequal amounts or quantities of resources and services depending on the area or location, such as medical or welfare. Some communities have a greater range of resources and services and then those that would be able to change that do not live near or associate with those communities making it almost impossible to change this cycle. The space within the different locations is the clustering of various groups of people who share similar socio-economic statuses. Spatial inequality is caused by various reasons, such as religion, culture, or race. Areas of people in poverty will remain that way until various resources and services are introduced. Resources are things such as fresh drinking water. Services include educational institutions and hospitals/other health services. Takinga spatialapproachinvolvescomparingtwodifferentgeographicalareas in relationto a particularvariable. Theaim of thisapproach is todetectinequalitiesbetweendifferentareasandtothenfindways of amendingtheseinequalities, therebymakingdistribution of resourcesandservicesmoreequitable (even) betweenpopulations http://en.wikipedia.org/wiki/Spatial_inequality
Identify the processes present explaining one An unequal society leads to social unrest, a growing dependence on social welfare, a taxation system to redistribute the wealth, programs to improve poor people’s quality of life and the growth of non-government organizations (NGOs) such as The Smith Family. • Taxation office • Centre link payments The taxation office takes more money off people who earn more rather than take a small amount of money from people who earn less. • Centrelink helps people who do not work to get an income or help to earn more money for example they have a pension for the elderly, a disability pension and the single parent pension. However with the single parent pension once your youngest child turns five, you most be either studying, working or looking for work (must be proven). Other wise you will be penalised through a percentage of your benefit being withheld.
THE Sydney suburb of Edgecliff and surrounding area is the nation's richest with an average income of more than $186,000 a year. • That's more than $20,000 ahead of Toorak in Victoria, which is Australia's second wealthiest suburb with a mean income of more than $165,000. • Victoria's Portsea is the third richest, with an average income of just over $160,000 but down nearly 30 per cent on the previous tax year. Portsea topped the nation's wealthiest suburbs in 2006-07 with an average income of $219,345. • Tax office data released yesterday revealed the country's wealthiest and poorest areas for the 2007-08 tax year, as well as how much tax we're paying and how much we're deducting. • The data also provides an insight into the disparity between the nation’s richest and poorest workers. • The residents of Sydney’s 2027 postcode – which include Westfield's Frank Lowy with an estimated worth of $4.2 billion - earn $159,000 more than the country’s poorest area, which the ATO names as Callaghan. • Callaghan is the area covering the student halls of residence at NSW's University of Newcastle. The average income is just over $27,000. • State breakdown • Western Australia’s Peppermint Grove and Cottesloe tops the mining state with $130,057. • In Queensland, Ascot and Hamilton top their state with an average income of $101,000. • While QLD, WA, New South Wales and Victoria's richest have an average income of more than $100,000, South Australia’s wealthiest suburb, North Adelaide, has an average of $84,790. • The Northern Territory's 880 postcode, which includes the suburbs of Gapuwiyak, Gove, Gunyangara, Nhulunbuy and Yirrkala, is the state’s best earner with an average of $76, 427. • In the ACT, the suburbs of Forrest, Griffith, Manuka and Red Hill claim the top spot with an average income of $91,209. • Tasmania's 7005 postcode, capturing the suburbs of Dynnyrne, Lower Sandy Bay and the University of Tasmania is the state's wealthiest with an average income of $65,174. • Analysing the nation’s tax returns, the data revealed Australian workers paid more than $583 billion in tax in 2007-08, an increase of more than 9 per cent on the previous year. • And an additional 840,000 people lodged tax returns, with workers eager to grab a slice of Kevin Rudd’s stimulus package which paid a $900 cash bonus to those earning under $80,000. • The Australian reported while the number of people filing returns rose 7.1 per cent, the total value of tax deductions claimed leapt 19.1 per cent.
Spatial impact • The impacts of spatial inequality is • Conflict and crime can occur due to social injustice, racism and socioeconomic divide. • Enclaves of poverty occur spatially and socially. • The juxtaposition of the Aboriginal and non-Aboriginal population age and sex profiles in the population pyramid, graphically demonstrates the differences. A corollary of these differences is the shorter life expectancy of Aboriginal than non-Aboriginal people. For NSW, this gap is 16.4 years for males and 16.8 years for females. • The death rate in Indigenous communities is believed to be up to 17 times higher than that of non-Indigenous Australians, mainly due to high levels of cardiovascular disease • 63% percentage of Aboriginal employees at lower salary levels. • 12.6% unemployment rate gap between indigenous and non-indigenous people in 2009
Case study one- low income bracket • Jeremy is a fourteen-year old boy living in Broadmeadows in Melbourne. Jeremy lives in a flat with his two younger sisters and his mother. Jeremy's mother worked in a factory until a year ago, when she was laid off from her job. Since then, Jeremy and his family have found things very tough. His mum can't find a new job and is now suffering from depression. Some days she can't even get out of bed. Jeremy has had to take on a part-time job to help make ends meet. Even though he isn't supposed to, Jeremy works until midnight some nights and then has trouble staying awake the next day. Jeremy tries to make himself and his sisters' lunches to take to school, but often they have nothing in the cupboard except a few crackers. When everyone else went on a school excursion last week, Jeremy had to stay behind because his mum could not afford the excursion fee. Jeremy doesn't have a lot of friends at school, because he's not part of the "in" crowd. His clothes are bought from op shops and his sports sneakers are from Kmart - not Nike. While others get pocket money and go out to the movies and Timezone on the weekends, Jeremy gives all the money he earns to his mum to buy groceries. • Case Study Two -- Middle Income • Bracket Luke is a fourteen-year old boy living in Karana Downs in Brisbane. Luke's father is a mechanic and his mother is a part-time teacher's aide at the local primary school. Luke has an older brother and a younger sister. Luke's favourite hobbies are PlayStation and playing soccer. Each week, he receives $15 pocket money for mowing the lawn. This pocket money is for treats like going to the movies with his friends. His parents still pay for all his needs including his clothes, shoes and out of school activities. Luke always has three good meals a day and his mother keeps the pantry stocked with his favourite foods. They eat out or have takeaway at least once a week. Every year they drive to the coast to spend three weeks holidays in Noosa, a beach resort town. • Case Study Three - High Income Bracket Eliza Jane is a fourteen-year-old girl living in Darling Harbour, Sydney. Her father is an investment banker and travels the world with her stepmother on business. Eliza Jane attends a prestigious private boarding school on the North Shore of Sydney. She takes her class notes on a new laptop computer and schedules activities with her friends on her palm pilot. She gets $100 a week allowance to buy clothes, shoes makeup, CD's and whatever else she likes. She has her own TV and DVD player in her bedroom at home and at school. Eliza Jane looks forward to the holidays when she joins her father and stepmother at an exotic location. Last term it was Paris and these holidays it will be the Bahamas. Read more: http://wiki.answers.com/Q/Does_spatial_inequality_exist_in_Australia#ixzz1maSuN4MY