Download
1 / 40
400 likes | 494 Views
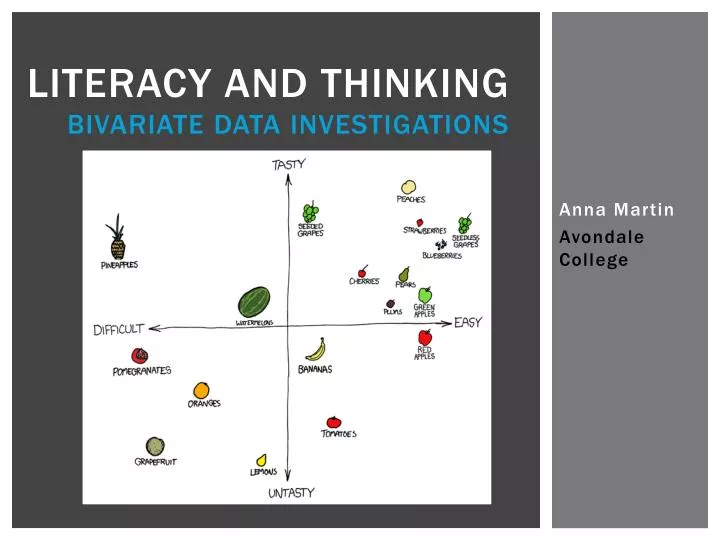
Literacy and thinking bivariate data investigations. Anna Martin Avondale College. Literacy and thinking. Thinking about data Thinking about relationships Thinkin g about sources of variation Communicating understanding Improving literacy. Thinking behind unit.

E N D
Literacy and thinkingbivariate data investigations Anna Martin Avondale College
Literacy and thinking • Thinking about data • Thinking about relationships • Thinking about sources of variation • Communicating understanding • Improving literacy
Thinking behind unit • Who were we doing the unit with? • What was there prior knowledge? • What were their identified needs? • What strategies could we use? • What else did we know had worked previously?
Literacy and thinking strategies • SOLO for levels of thinking – identify features, use features to explain relationships • Structuring paragraphs using TEXT • T (topic sentence) • E (evidence) • X (explanation) • T (tie up)
Setting the context What areas might be affected? Is this for real? What are people worried about? How could you get data?
UNPACKING LEARNING OUTCOMES • LO: Use the statistical enquiry cycle to investigate multivariate data • Get students to try to explain what the words enquiry, cycle and multivariate mean • Share understandings and acknowledge contributions • Model more than one way to explain something
FROM ONE variable to two • Focus on rental prices (one variable) • Explore what might be affecting/linked/related to rental prices e.g. rugby world cup, suburb, number of bedrooms • Lots of structure early on to help with writing
FROM ONE variable to two • “How much is the typical weekly rent for a house in Kingsland?” • Analysis: Mark on your dot plot the lowest rental price and the highest rental price • Conclusion: Complete the sentence “In Kingsland, the rents range from $____ to $_____” • Analysis: Mark on your dot plot the middle 50% of house prices (remind them that half of 20 is 10, so where do the middle 10 house sit between). • Conclusion: Complete the sentence “The rents are typically between $____ and $____” • Analysis: Mark on your dot plot any common rent prices (modes) • Conclusion: Complete the sentence “Common rent prices in Kingsland are $___ and $____”
Why bivariate? • Get the students into the habit of reflecting on their investigation, in particular the data • Why do the rental prices in Kingsland vary so much? (answers could be: because the condition of houses are different, where they are located is different, how many bedrooms they have etc.) • Why are there two common rental prices? (one would be the typical price for 1-bedroom houses, and one would be the typical price for 2-bedroom houses)
Complete another CYCLE….. What happens when you compare the rent by number of bedrooms? Greater shift in rent prices (but still variation) What appears makes more difference to rent – where the house is, or how many bedrooms it has?
The paint brush Houses with fewer bedrooms tend to rent for less than houses with many bedrooms Still variation in rental prices for houses with the same number of bedrooms
Thinking about relationships Get the students to paint pictures e.g. use a paint brush to show the relationship between your age and your height Very scaffolded at first – put age along the bottom (in years) and put height along the side (in units of 10 cm) Students verbally describe what would happen as you get older Then try to paint the relationship (direction, type and strength by width of paint brush) Build up ideas of suitable units, scales, ranges for variables, explanatory/response, no relationships
The Ellipse Using for relationships we think are linear Not easy at first but students get there Helps position line of best fit Can use for informal predictions
Linking features and statements Use the names of the variables It’s a positive relationship because…. It’s a strong linear relationship because…. • Describe the relationship: • in context • positive/negative • strength/type • does it make sense? Points are close to the line Overall the points look like they make a line The line slopes up As one gets bigger the other gets bigger Low goes with low, high goes with high
Formative assessment Is there a relationship between the size of a family and the number of bedrooms for their house?
Bi-variate investigation LO: Use the relationship between two variables to make a prediction
LO: Use the relationship between two variables to make a prediction Relate features of a relationship Describe the relationship Use the relationship to make a prediction
LO: Use the relationship between two variables to make a prediction
Problem LO: Use the relationship between two variables to make a prediction You want to manufacture a 10G memory stick. How much do you charge for it?
Plan LO: Use the relationship between two variables to make a prediction Collect data about what other USB sticks cost. On the next few pages are USB sticks being sold by Dick Smith Electronics. For each one, record in a table how many GB they are, and their selling price.
Data (example of table) LO: Use the relationship between two variables to make a prediction
Data LO: Use the relationship between two variables to make a prediction
Data LO: Use the relationship between two variables to make a prediction
Analysis LO: Use the relationship between two variables to make a prediction There are no USB drives that are 10GB currently advertised. How do we work out how much we should charge? Problem: Is there a relationship between the GB of a memory stick, and how much is costs?
Analysis LO: Use the relationship between two variables to make a prediction Draw a scatter plot of the data.
Conclusion (relationship) LO: Use the relationship between two variables to make a prediction Describe the relationship between GB and price for the USB sticks. Is it a linear relationship? Positive/negative? Strength? Amount? Unusual?
Conclusion (prediction) LO: Use the relationship between two variables to make a prediction Use the relationship to make a prediction for 10GB. Try to imagine painting across the values, draw the ellipse, add the line Use the line to see how much a 10GB memory stick might cost Answer the problem!!
Reflection LO: Use the relationship between two variables to make a prediction Think about where the data came from, what else might effect the price of a USB memory stick, what you could do to extend the investigation. Write two “I wonder….” statements for this investigation.
Bivariate investigation LO: Write a plan for a bivariate investigation
LO: Write a plan for a bivariate investigation List the steps for a method Identify variables for the investigation Describe how the variables will be measured Explain how the data will be collected Decide how much data to collect
Problem LO: Write a plan for a bivariate investigation What is the relationship between the size of the hard-drive memory and the selling price for laptops?
What variables will you investigate? What is the relationship between the size of the hard-drive memory and the selling price for laptops? LO: Write a plan for a bivariate investigation WRITE: The variables I will investigate are…… The size of the hard-drive memory and the selling price for different laptops WRITE: The explanatory variable will be …… Hard-drive memory (because I think this will explain the selling price of the laptop) WRITE: The response variable will be …… Selling price (because I think this will change/respond to different sizes of hard-drives)
How will you collect data for the investigation? What is the relationship between the size of the hard-drive memory and the selling price for laptops? LO: Write a plan for a bivariate investigation THINK: Are the variables things I can measure myself or can I find measures for the variables from somewhere? These variables have already been measured by stores or people selling laptops WRITE: I can collect data for this investigation by …… Getting ads for laptops being sold that say how big the hard-drive memory is and what price the laptop is being sold for from advertising pamphlets.
How will you measure these variables? What is the relationship between the size of the hard-drive memory and the selling price for laptops? LO: Write a plan for a bivariate investigation THINK: What units should I use? How accurate do I need to be? What equipment do I need? WRITE: I will measure the variables by using….. GB for the hard-drive memory and rounding the selling price to the nearest $100.
What things might affect the measures you take? What is the relationship between the size of the hard-drive memory and the selling price for laptops? LO: Write a plan for a bivariate investigation THINK: Does it matter where I get my data from? Do I need to be careful about getting a range of data? Should I focus my investigation more? WRITE: I wonder if things like…………. might also affect the selling price for laptops the screen size, the processing speed, how the laptop looks
How many measures will you collect? What is the relationship between the size of the hard-drive memory and the selling price for laptops? LO: Write a plan for a bivariate investigation THINK: How much data do I need? If I am working in a group, how much should each of us collect? 30 WRITE: I will collect data about ______ different laptops. We will make sure __________________ we each collect around 10 values each
How will you record your results? What is the relationship between the size of the hard-drive memory and the selling price for laptops? LO: Write a plan for a bivariate investigation THINK: What things should I write down for each laptop? How will I organise this data? table WRITE: I will use a ________ to record my results. I will use ______ columns for each of the two variables. 2
Group work! What is the relationship between the size of the hard-drive memory and the selling price for laptops? LO: Write a plan for a bivariate investigation In your group, discuss how you will each contribute to the development of a plan for the assessment. Make a commitment to each person that you will attend each day of the assessment and that you will not let them down. Write down how you will demonstrate to your teacher that each person has contributed to the writing of the plan.