Download
1 / 6
60 likes | 73 Views
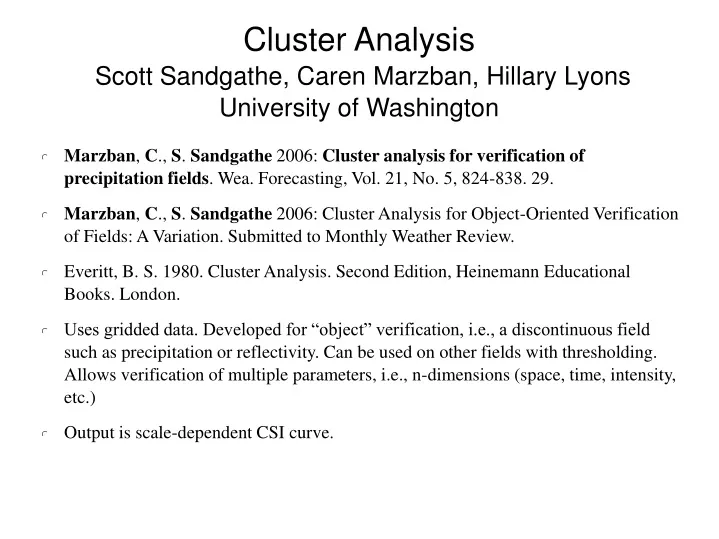
Cluster Analysis Scott Sandgathe, Caren Marzban, Hillary Lyons University of Washington. Marzban , C ., S . Sandgathe 2006: Cluster analysis for verification of precipitation fields . Wea. Forecasting, Vol. 21, No. 5, 824-838. 29.

E N D
Cluster AnalysisScott Sandgathe, Caren Marzban, Hillary LyonsUniversity of Washington • Marzban, C., S. Sandgathe 2006: Cluster analysis for verification of precipitationfields. Wea. Forecasting, Vol. 21, No. 5, 824-838. 29. • Marzban, C., S. Sandgathe 2006: Cluster Analysis for Object-Oriented Verification of Fields: A Variation. Submitted to Monthly Weather Review. • Everitt, B. S. 1980. Cluster Analysis. Second Edition, Heinemann Educational Books. London. • Uses gridded data. Developed for “object” verification, i.e., a discontinuous field such as precipitation or reflectivity. Can be used on other fields with thresholding. Allows verification of multiple parameters, i.e., n-dimensions (space, time, intensity, etc.) • Output is scale-dependent CSI curve.
CA-based Methodology For a given forecast and observed field: - The observation and the forecast field is combined into a single field. - Initially, there are as many clusters in the field as the number of non-zero pixels. - K-mean clustering (with k=100) is employed to identify 100 clusters. - Agglomerative hierarchical clustering is employed to iteratively combine the clusters until only one cluster remains (containing the entire field). - At each iteration, a given cluster is declared as “hit” if the proportion of observed pixels is between 20% and 80%. Otherwise, it's a miss (>80% obs) or a false alarm (<20% obs). - At each iteration, the Critical Success Index (CSI) is computed. - A simple methodology is used to compute the confidence intervals for the data. An example:
An Example of k-means clustering with k=100, performed on the combined set of forecasts and observations.
Cluster Analysis • Strengths? (Too soon to be certain.) • Attempt to give comprehensive “single number” answer to goodness between models. Can consider location, timing, intensity for discontinuous field in a completely automated manner. • Contains scale-dependency information. • Appears to work based on few cases! • Weaknesses? • Only run on 30 complex cases. Need to do idealized cases, more comprehensive analysis to develop confidence and understanding of results. • “Single number” answer to a complex question.