Download
1 / 19
190 likes | 348 Views
13 th TRB National Planning Applications Conference May 8-12, 2011. Reno, Nevada . Travel Demand Modeling Tools to Support Smart Growth and Climate Change Policies. Tara Weidner, Rosella Picado and Erin Wardell Parsons Brinckerhoff. Proposed GHG reduction strategies. Road pricing

E N D
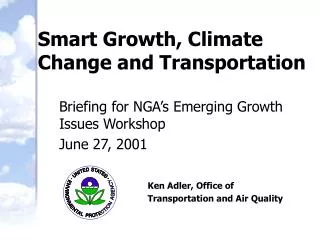
13th TRB National Planning Applications Conference May 8-12, 2011. Reno, Nevada Travel Demand Modeling Tools to Support Smart Growth and Climate Change Policies Tara Weidner, Rosella Picado and Erin Wardell Parsons Brinckerhoff
Proposed GHG reduction strategies • Road pricing • Compact land use and smart growth • Non-motorized transportation • Public transportation improvement • Ride-sharing, car-sharing and alternative commute / work schedules • Regulatory • Operational and intelligent transportation systems • Bottleneck relief and capacity expansion • Multi-modal freight strategies Cambridge Systematics, Inc. (2009). Moving Cooler.
Desired policy levers • TAZ– level land use characteristics • Parcel – level land use density and development mix • Pedestrian environment characteristics • Road capacity and HOV lane expansion • Traffic operations improvements • New or improved transit service • Improved transit accessibility • Transit fare policies • Road pricing (tolls, congestion, VMT) • Parking pricing and management • Transportation demand management • Port and airport ground access policies • Goods movement strategies California MPO Self-Assessment of Modeling Capability
Desired exogenous factors • Population attributes: income, age, employment status, household size, type of housing unit, presence of children • Population rate of growth • Regional employment mix and distribution • Gasoline prices • Vehicle fleet fuel efficiency • Person mobility attributes
Travel demand models are being asked to inform: • Alternatives analyses • Project evaluation • Environmental justice • Revenue generation • Risk and uncertainty analyses • Long term housing and commercial needs • Public involvement workshops • Regional consensus building
Travel demand modeling tool options Sketch planning and visioning tools • More advanced, integrated and comprehensive models are: • costly to develop, • require highly skilled staff to develop and use, • take longer to run, • generate vast amounts of data • When is this investment worth the effort? 3-step models + post-processors Advanced trip-based models Activity-based models Integrated land use & transport models
Modeling tool selection criteria • Type of answer sought by stakeholders • Strategies and policy levers • Performance measures, equity impacts • Strengths and weaknesses of various modeling approaches • Resources available to develop and apply the model --staff, data, schedule, funding
Sketch planning & visualization tools • Land use planning / consensus building • VMT and emissions based on average input trip lengths and elasticities • Sketch-level alternative evaluation • density • simple j-h balance • vehicle emissions • building emissions
Sketch planning and visualization tools: GreenSTEP • Disaggregate representation of households and their demand for vehicles, travel, and fuel consumption • Simplified representation of transport system
Trip-based model + post-processor • Gain over simpler method: • Local vehicle trips forecasted by 3 or 4-step model • Both trip ends are known • VT and VMT elasticities are often from local household survey • Limitations: • Assumption of constant elasticities valid only over limited range • Unable to assess vacant to non-vacant impacts • Silent on whether the trip reductions are true reductions or mode shifts • None to very limited applicability to transit and pricing strategies
Advanced trip-based models • Retain the advantages of a multi-modal trip-based model: • Adequate trip market stratification • Comprehensive mode choice model • Adequate representation of transit accessibility and competing levels of service • Auto ownership and destination choice models informed by multi-modal accessibility variables • While accounting for the effect of land use form, transit and pricing explicitly in the model specification
Activity-based models • Gains over trip-based models: • Model entire tours consistently • Use accessibilities relevant to the traveler, instead of zonal aggregates • Rich set of person and household attributes able to inform travel decisions • Explicitly account for constraints derived from household member interactions • Able to identify the true price paid by different users for parking and transit, and other mobility attributes • Mathematical consistency across all travel decisions results in improved, more realistic responses to policy
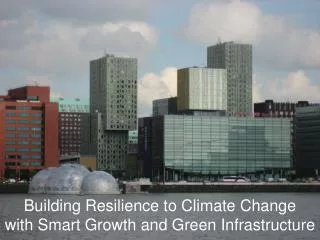
Integrated land use / transport models • Dynamically account for the effect of transport level of service on land use, and vice-versa • Allow examining and comparing the long term effects of climate change transport policies • Explicit assumptions on land development potential (zoning, density, mixed use) • Inter-industry relationships influence on location decisions, more realistic land use mix • Market signals and access (generalized cost) influence land use changes (vacant land, redevelopment, densification) and demand for transportation
Compact/Smart development Quickly winnow down multiple scenarios Comprehensive along land use types and household types Order of magnitude Complementary effects of compact development, transit and pricing on transport network at facility level Market-drive densities Explicit land use policy levers Sketch planning tool Post-processor Advanced 4-step model Integrated LU/T model GHG emission reductions due to anticipated changes in density, land use mix
Transit service GHG reductions from user subsidies, mobility attributes GHG reductions across subpopulations Rich distributional impacts Alternatives analysis and project design GHG reductions by population segment None to limited existing service Single-purpose market GHG reduction potential Advanced 4-step model Activity-based model Direct demand model
Conclusions • No single modeling tool can address the multiple and varying needs of the planning process, or is universally better • The tradeoffs between simplicity and behavioral realism is more than a tradeoff between fast and simple vs. long and complex models • The selection of an appropriate tool depends on • Strategies and policies • Detail of the answer sought (VMT?, equity?) • Stage of the planning process