Download
1 / 6
60 likes | 200 Views
Red-Light Running: All-Red Clearance Intervals and Larger Signal Lenses. A Michigan Success Story. FHWA-SA-09-014. The Challenge. Red-light running causes more than 170,000 injuries and 900 deaths per year 1 .

E N D
Red-Light Running:All-Red Clearance Intervals and Larger Signal Lenses A Michigan Success Story FHWA-SA-09-014
The Challenge • Red-light running causes more than 170,000 injuries and 900 deathsper year1. • Driver speeding and distracted driving, as well as inability to see the traffic control device in time to comply are common problems. • Clearance intervals, together with increasing the size of the signal lenses, have been shown to improve intersection safety. • Cities of Detroit and Highland Park sought simple, low-cost safety treatments to increase driver compliance with traffic signals, and reduce the number and severity of crashes at urban signalized intersections. 1. Federal Highway Administration Red-Light Running Web Site (2008), http://safety.fhwa.dot.gov/intersection/redlight/.
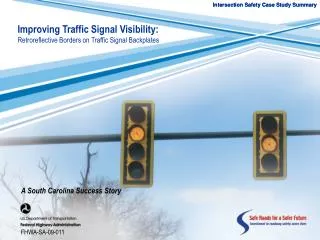
Solution All-red interval and larger signal lens: • Replace red, yellow, and green 8-inch signal lens with 12-inch signal lens • Added an all-red clearance interval rangingfrom 1-2 seconds2 2. Calculated using Institute of Transportation Engineers (ITE) guidelines.
Technical Data • Location: • 33 high-crash locations in the cities of Detroit and Highland Park, Michigan • Speed Limits: • Ranged from 35 mph to 40 mph • Implementation Cost: • Total corridor cost of $2.3 million at $70,000 per intersection • Implementation Time: • 6 months • Implementation Issues: • The cities experienced no implementation issues with these countermeasures
Results at Treated Intersections • Average Crash Reductions: • 75.7% reduction in angle crashes per year • 45.5% reduction in injury crashes per year • 33.3% reduction in total crashes per year
For More Information • Visit FHWA’s intersection safety web site to download this and other case studies highlighting proven intersection safety treatments from across the country: http://safety.fhwa.dot.gov/intersections/ • Or contact: Tapan Datta Transportation Research GroupWayne State University Phone: (313) 577-9154 E-mail: tdatta@eng.wayne.edu Ed Rice Office of Safety (HSSD) Federal Highway Administration Phone: (202) 366-9064 E-mail: ed.rice@dot.gov