Download
1 / 6
60 likes | 172 Views
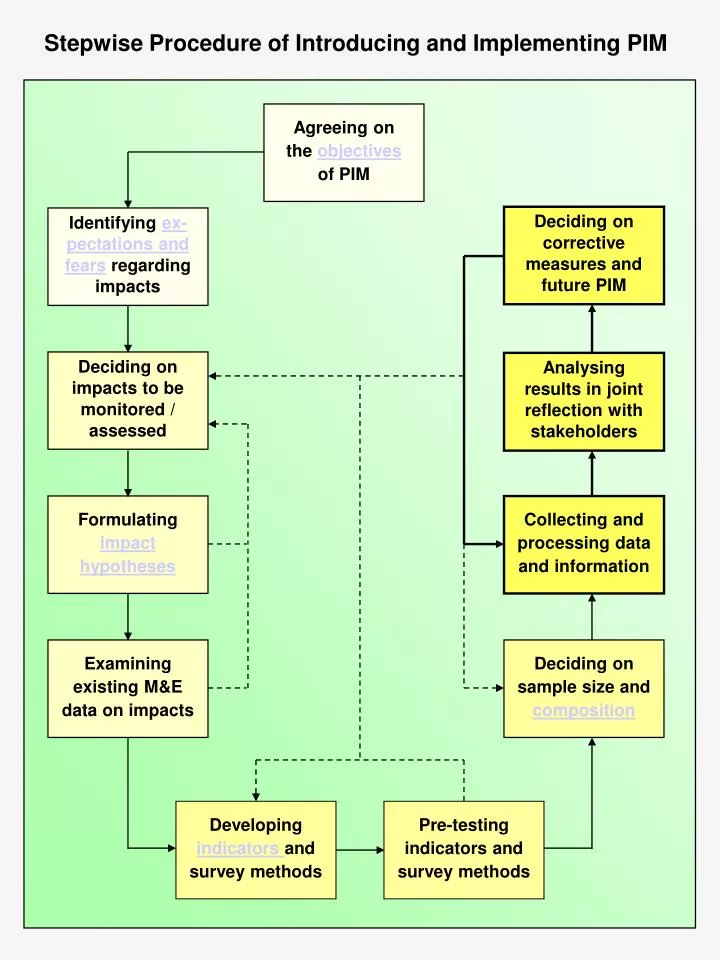
Stepwise Procedure of Introducing and Implementing PIM. Deciding on corrective measures and future PIM. Deciding on impacts to be monitored / assessed. Analysing results in joint reflection with stakeholders. Collecting and processing data and information.

E N D
Stepwise Procedure of Introducing and Implementing PIM Deciding oncorrectivemeasures andfuture PIM Deciding onimpacts to bemonitored /assessed Analysingresults in jointreflection withstakeholders Collecting andprocessing dataand information Examiningexisting M&E data on impacts Pre-testingindicators andsurvey methods Agreeing onthe objectivesof PIM Identifying ex-pectations andfears regardingimpacts Formulatingimpacthypotheses Deciding onsample size andcomposition Developingindicatorsandsurvey methods
Objectives of Participatory Impact Monitoring (PIM) Improvingprojectsteering Promotinglearningprocesses Promotingcapacitybuilding Improvinginteraction PIM:the continuous observation, systematic documentation, and critical reflection of project impact, done byproject staff and target groups, using own survey results Link
Identifying expectations and fears regarding project impact PRMP’sexpectationsand fears IFAD’sexpectationsand fears Target groups’expectationsand fears Link
Formulating Impact Hypotheses (example) Impact:Increased number of foodself-sufficient farm households Extensionservices Loans Influenceof groupsformed byproject Irrigationservices Familyplanning pro-gramme (re-duction ofbirth rate) Exchangeof experiencewithin thecommunity Welfarepolicy (pro-motion for the poor, e.g.subsidies) Access toagricultureand forestryservices Loansfrom otherinstitutions Externalfactors Project activitiesand outputs Link
Composition of the Sample: ‘With’ / ‘Without Project’ Approach Villageswith 5 yearsof project Villageswith 1 yearof project Villageswith 5 yearsof project Villageswith 1 yearof project AdditionalPRMP/IFAD input PRMP’s /IFAD’simpact Role ofwomen +Otherprogrammes Foodsecurity Role ofwomen Otherprogrammes Foodsecurity Capacityof VDBs +Otherexternalfactors +Otherexternalfactors Capacityof VDBs Quality ofservices Quality ofservices DIFFERENCES INOBSERVED CHANGES DIFFERENTINPUTS PRMP Link
Indicator sheet IMPACT Finally agreed formulation of the positive ornegative change to be observed DEFINITIONS Definition of key terms used in the impactformulation INDICATOR(S) Detailed description of impact, largely basedon the definition of key terms RESPONDENT(S) Who is most knowledgeable about theimpact, who else should be asked METHOD(S) Which tools are going to be used to measurethe indicator(s) SAMPLING How the respondents are selected, how bigthe sample size is INDICATOR RATIONALEAND LIMITATIONS Why it is a good indicator, which aspects are covered by the indicator, which are not INSTRUCTIONS FORDATA COLLECTION Interview guideline (questionnaire), instruc-tion on how to facilitate the RRA / PRA tool INSTRUCTIONS FORDATA PROCESSING Instruction on how to document, store, and present data / information LIMITATIONS OF THEMETHOD(S) Assessment of the user-friendliness andcost-effectiveness of the method Link