Download
1 / 53
560 likes | 1.12k Views
Health Economics. Comparing different allocations Should we spent our money on Wheel chairs Screening for cancer Comparing costs Comparing outcome Outcomes must be comparable Make a generic outcome measure. Outcomes in health economics. Specific outcome are incompatible

E N D
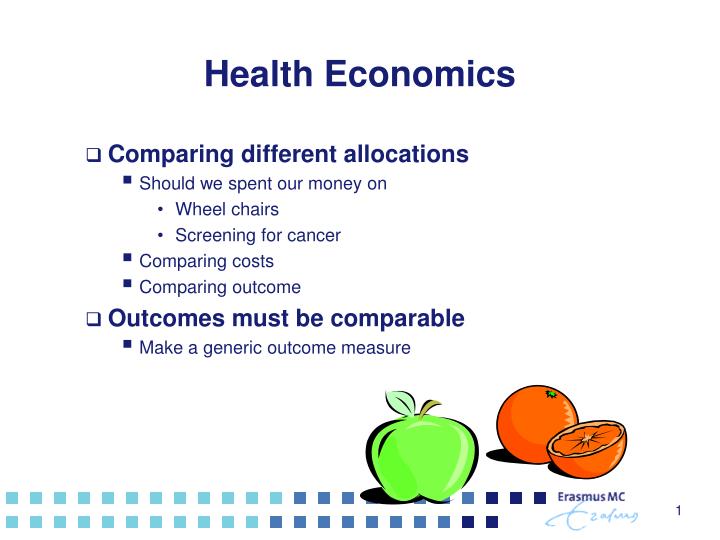
Health Economics • Comparing different allocations • Should we spent our money on • Wheel chairs • Screening for cancer • Comparing costs • Comparing outcome • Outcomes must be comparable • Make a generic outcome measure
Outcomes in health economics • Specific outcome are incompatible • Allow only for comparisons within the specific field • Clinical successes: successful operation, total cure • Clinical failures: “events” • Generic outcome are compatible • Allow for comparisons between fields • Life years • Quality of life • Most generic outcome • Quality adjusted life year (QALY)
Quality Adjusted Life Years (QALY) • Multiply life years with quality index • Quality of life index • 1.0 = normal health • 0.0 = death (extremely bad health) • Example • Losing sense of sight • Quality of life index is 0.5 • Life = 80 years • 0.5 x 80 = 40 QALYs
Which health care program is the most cost-effective? • A new wheelchair for elderly (iBOT) • Special post natal care
Which health care program is the most cost-effective? • A new wheelchair for elderly (iBOT) • Increases quality of life = 0.1 • 10 years benefit • Extra costs: $ 3,000 per life year • QALY = Y x V(Q) = 10 x 0.1 = 1 QALY • Costs are 10 x $3,000 = $30,000 • Cost/QALY = 30,000/QALY • Special post natal care • Quality of life = 0.8 • 35 year • Costs are $250,000 • QALY = 35 x 0.8 = 28 QALY • Cost/QALY = 8,929/QALY
Egalitarian Concerns:Burden of disease 1.0 Utility of Health 0.0 A B C
Burden as criteria Pronk & Bonsel, Eur J Health Econom 2004, 5: 274-277
Top 6 journals Cost Utility Analysis www.tufts-nemc.org/cearegistry
Most debate about the QoL estimates • Unidimensional QoL • In QALY we need a unidimensional assessment of Quality of life • Rules out multidimensional questionnaires • SF-36, NHP, WHOQOL
Utility assessment • Unidimensional QoL • Often called ‘utility’
Who to ask? The patient, of course!
The clinical perspective • Quality of life is subjective….. • “Given its inherently subjective nature, consensus was quickly reached that quality of life ratings should, whenever possible, be elicited directly from patients themselves. “ • (Niel Aaronson, in B. Spilker: Quality of life and Pharmacoeconomics in Clinical Trails, 1996, page 180) • …therefore ask the patient!
Patient values count…. • […] the best way to do this, the technology, is a patient-based assessment. They report, they evaluate, they tell you in a highly standardized way, and that information is used with the clinical data and the economic data to get the best value for the health care dollar.” • John Ware
Healthy Death A problem in the patient perspective…. • Stensman • Scan J Rehab Med 1985;17:87-99. • Scores on a visual analogue scale • 36 subjects in a wheelchair • 36 normal matched controls • Mean score • Wheelchair: 8.0 • Health controls: 8.3
The economic perspective • In a normal market: the consumer values count • The patient seems to be the consumer • Thus the values of the patients…. • If indeed health care is a normal market… • But is it….?
Health care is not a normal market • Supply induced demands • Government control • Financial support (egalitarian structure) • Patient Consumer • The patient does not pay • Consumer = General public • Potential patients are paying • Health care is an insurance market • A compulsory insurance market
Health care is an insurance market • Values of benefit in health care have to be judged from a insurance perspective • Who values should be used the insurance perspective?
Who determines the payments of unemployment insurance? • Civil servant • Knowledge: professional • But suspected for strategical answers • more money, less problems • identify with unemployed persons • The unemployed persons themselves • Knowledge: specific • But suspected for strategical answers • General public (politicians) • Knowledge: experience • Payers
Who’s values (of quality of life) should count in the health insurance? • Doctors • Knowledge: professional • But suspected for strategical answers • See only selection of patient • Identification with own patient • Patients • Knowledge: disease specific • But suspected for strategical answers • But coping • General public • Knowledge: experience • Payers • Like costs: the societal perspective
Validated questionnaires MOBILITY • I have no problems in walking about • I have some problems in walking about • I am confined to bed SELF-CARE • I have no problems with self-care • I have some problems washing or dressing myself • I am unable to wash or dress myself USUAL ACTIVITIES (e.g. work, study, housework family or leisure activities) • I have no problems with performing my usual activities • I have some problems with performing my usual activities • I am unable to perform my usual activities PAIN/DISCOMFORT • I have no pain or discomfort • I have moderate pain or discomfort • I have extreme pain or discomfort ANXIETY/DEPRESSION • I am not anxious or depressed • I am moderately anxious or depressed • I am extremely anxious or depressed
Describe health states Have values from the general public Rosser Matrix QWB 15D HUI Mark 2 HUI Mark 3 EuroQol EQ-5D Validated Questionnaires
EQ-5D, HUI and SF-36 Of the shelf instruments….
The Rosser & Kind index • One of the oldest valuation • 1978: Magnitude estimation • Magnitude estimation PTO • N = 70: Doctors, nurses, patients and general public • 1982: Transformation to “utilities” • 1985: High impact article • Williams A. For Debate... Economics of Coronary Artery Bypass Grafting. British Medical Journal 291: 326-28, 1985. • Survey at the celebration of 25 years of health economics: chosen most influential article on health economics
More health states • Criticism on the Rosser & Kind index • Sensitivity (only 30 health states) • The unclear meaning of “distress” • The compression of states in the high values • The involvement of medical personnel • New initiatives • Higher sensitivity (more then 30 states) • More and better defined dimensions • Other valuation techniques • Standard Gamble, Time Trade-Off • Values of the general public
No longer value all states • Impossible to value all health states • If one uses more than 30 health states • Estimated the value of the other health states with statistical techniques • Statistically inferred strategies • Regression techniques • EuroQol, Quality of Well-Being Scale (QWB) • Explicitly decomposed methods • Multi Attribute Utility Theory (MAUT) • Health Utility Index (HUI)
Statistically inferred strategies • Value a sample of states empirically • Extrapolation • Statistical methods, like linear regression • 11111 = 1.00 • 11113 = .70 • 11112 = ?
Explicitly Decomposed Methods • Value dimensions separately • Between the dimensions • What is the relative value of: • Mobility…... 20% • Mood…….. 15% • Self care.… 24%. • Value the levels • Within the dimensions • What is the relative value of • Some problems with walking…… 80% • Much problems with walking…... 50% • Unable to walk…………………….10%
Explicitly Decomposed Methods • Combine values of dimensions and levels with specific assumptions • Multi Attribute Utility Theory (MAUT) • Mutual utility independence • Structural independence
Explicitly Decomposed Methods • Health Utilities Index (Mark 2 & 3) • Torrance at McMaster • 8 dimensions • Mark 2: 24.000 health states • Mark 3: 972.000 health states • The 15-D • Sintonen H. • 15 dimensions • 3,052,000,000 health states (3 billion)
More health states, higher sensitivity ? (1) • EuroQol criticised for low sensitivity • Low number of dimensions • Development of EQ-5D plus cognitive dimension • Low number of levels (3) • Gab between best and in-between level
More health states, higher sensitivity ? (2) • Little published evidence • Sensitivity EQ-5D < SF-36 • Compared as profile, not as utility measure • Sensitivity EQ-5D HUI • Sensitivity the number of health states • How well maps the classification system the illness? • How valid is the modelling? • How valid is the valuation?
More health states, more assumptions • General public values at the most 50 states • The ratios empirical (50) versus extrapolated • Rosser & Kind 1:1 • EuroQol 1:5 • QWB 1:44 • SF-36 1:180 • HUI (Mark III) 1:19,400 • 15D 1:610,000,000 • What is the critical ratio for a valid validation?
SF-36 as utility instrument • Transformed into SF6D • SG • N = 610 • Inconsistencies in model • 18.000 health states • regression technique stressed to the edge • Floor effect in SF6D
Conflicting evidence sensitivity SF-36 Liver transplantation, Longworth et al., 2001
Conclusions More states better sensitivity The three leading questionnaires have different strong and weak points
Value a health state • Wheelchair • Some problems in walking about • Some problems washing or dressing • Some problems with performing usual activities • Some pain or discomfort • No psychosocial problems
Uni-dimensional value • Like the IQ-test measures intelligence • Ratio or interval scale • Difference 0.00 and 0.80 must be 8 time higher than 0.10 • Three popular methods have these pretensions • Visual analog scale • Time trade-off • Standard gamble
Normal health X Dead Visual Analogue Scale • VAS • Also called “category scaling” • From psychological research • “How is your quality of life?” • “X” marks the spot • Rescale to [0..1] • Different anchor point possible: • Normal health (1.0) versus dead (0.0) • Best imaginable health versusworse imaginable health
Time Trade-Off • TTO • Wheelchair • With a life expectancy: 50 years • How many years would you trade-off for a cure? • Max. trade-off is 10 years • QALY(wheel) = QALY(healthy) • Y * V(wheel) = Y * V(healthy) • 50 V(wheel) = 40 * 1 • V(wheel) = .8
Standard Gamble • SG • Wheelchair • Life expectancy is not important here • How much are risk on death are you prepared to take for a cure? • Max. risk is 20% • wheels = (100%-20%) life on feet • V(Wheels) = 80% or .8
Consistent picture of difference 103 students
Health economics prefer TTO/SG • Visual analogue scale • Easy • No trade-off: no relation to QALY • No interval proportions • Standard Gamble / Time trade-Off • Less easy • Trade-off: clear relation to QALY • Interval proportions • Little difference between SG and TTO
Little difference between Cost/Life Year and Cost/QALY Richard Chapman et al, 2004, Health Economics