Download
1 / 20
200 likes | 336 Views
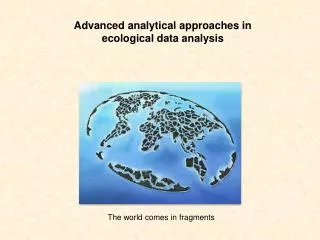
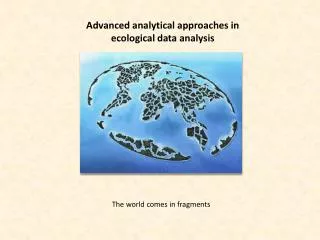
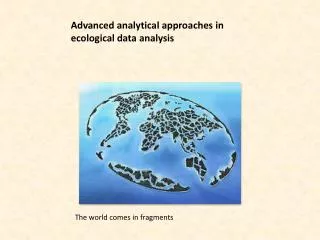
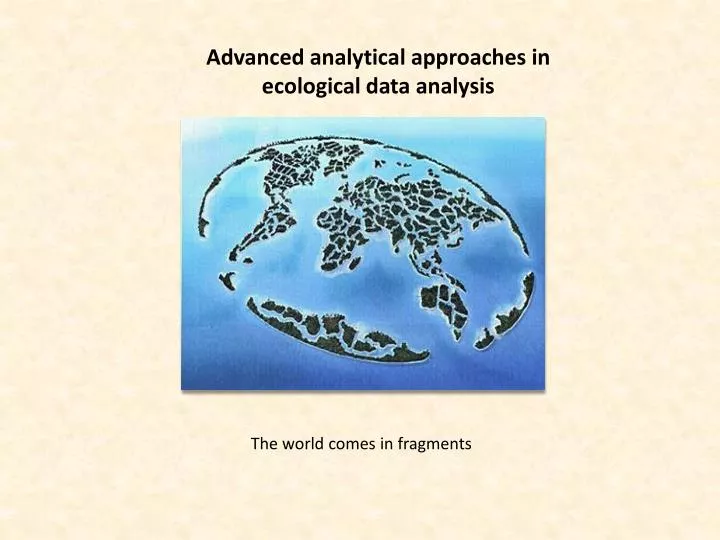
Advanced analytical approaches in ecological data analysis. The world comes in fragments. Early plant succession in the Saxon (Germany) post brown co a l mining area Chicken Creak. 2005. 2010.

E N D
Advanced analyticalapproaches in ecological data analysis Theworldcomesinfragments
Early plant succession in the Saxon (Germany) post brown coal mining area Chicken Creak 2005 2010 Succession starts with colonising species from a regional species pool and from the initial seed bank
Species co-occurrences How do patterns of species co-occurrences change in time? Basic questions Which species colonise initially? Is initial colonisation directional? Is colonisation predictable? Starting hypothesis Island biogeography predicts initial species occurrences to be random. Compretition theory predicts equilibrium species occurrences to be not random but driven by interspecific competition. Early plant succession
How to test for (non-) randomness? Joined absences Clustered co-occurrence Joined co-occurrence Habitat filtering Reciprocal segregation Checkerboard Segregation Competition Common ecological requirements Facilitation, mutualism Reciprocal habitat requirements Habitat engineering by the earlier colonizer Habitat filtering Niche conservatism is the tendency of closed related species to have similar ecological requirements and life history raits Niche conservatism
Spatial species turnover (b-diversity) Sorting a presence-absence matrix according to the dominant eigenvectors of corresondence analysis (seriation) maximizes the number of occurrences along the left to right diagonal. Sort according to the dominant eigenvector of correspondence analysis Metric for spatial species turnover Squared correlation R2 of row and column ranks of species occurrrences.
A nested subset pattern Nestedness describes a situation where a species poorer site is a true subset of the next species richer site. A presence – absence matrix ordered according to total species richness (marginal totals, degree distributions) Unexpected absence Unexpected presence
The measurement of nestedness The distance concept of nestedness. Sort the matrix rows and columns according to some gradient. Define an isocline that divides the matrix into a perfectly filled and an empty part. The normalized squared sum of relative distances of unexpected absences and unexpected presences is now a metric of nestedness the nestednesstemperature.
Nestedness based on Overlap and Decreasing Fill (NODF) NODF is a gap based metric and more conservative than temperature.
Back to the Huehnerwasser How does species co-occurrence change during early succession?
The number of reciprocal species co-occurrences increases in time The degree of nestedness is at an average level (neithert nested nor anti-nested) The degree of species spatial turnover decreases in time But are raw scores reliable? What do we expect if colonisation were a simple random process?
Statistical inference using null models What is random in ecology? The proportional- proportional null model 1 1 1 Fill the matrix at random but proportional to observed marginal (row/column) totals until the observed total number of occurrences is reached 1 1 1 1 The fixed - fixed null model Fill the matrix at random until for each row and each column the observed total number of occurrences is reached Take a checkerboard pair and swap. Do this 100000 times to randomize the matrix.
Statistical inference using null models 400 randomized matrices Observed score - SES SES For each randomized matrix we calculate the respective metric (C-score, NODF, R2). The Fisherian significance levels P(-1 < X <+1) = 68% P(-1.65 < X < +1.65) = 90% P(-1.96 < X < +1.96) = 95% P(-2.58 < X < +2.58) = 99% P(-3.29 < X < +3.29) = 99.9% Standardized effect sizes (SES) are Z-transformed scores and can be linked to a normal distribution.
SES scores (FF mull model) The degree of reciprocal species segregation constantly increases during early succession Local plant communities are not significantly nested during succession Species spatial turnover peaks at intermediate stages of succession In ecological research raw metrics are most often meaningless!!
Different null assumptions give different answers PP FF PP FF
PP FF The FF null model assumes that sites are filled with species and that each species occupies the maximal number of sites. The PP null model assumes that sites might differ dynamically in species richness and that each species might occupy a variable number of sites. The PP null model points often to a random pattern in species occupancy.
Idiosyncratic species are those that deviate in their patterns of occurrences Cirsiumarvense increases (DeltaC < 0) the degree of nestedness None of the species decreases the nestedness pattern. There are few unexpected occurrences . All species behave similar.