Download
1 / 19
210 likes | 387 Views
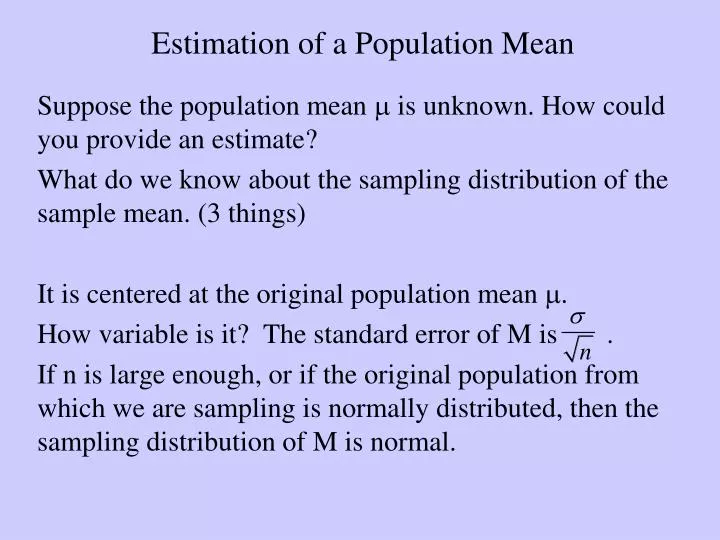
Estimation of a Population Mean. Suppose the population mean m is unknown. How could you provide an estimate? What do we know about the sampling distribution of the sample mean. (3 things) It is centered at the original population mean m .

E N D
Estimation of a Population Mean Suppose the population mean m is unknown. How could you provide an estimate? What do we know about the sampling distribution of the sample mean. (3 things) It is centered at the original population mean m. How variable is it? The standard error of M is . If n is large enough, or if the original population from which we are sampling is normally distributed, then the sampling distribution of M is normal.
Example of the Sampling Distribution of the Sample Mean Suppose we know the population we are drawing the sample from has a mean of m = 100 and a standard deviation of s = 21. Suppose the sample size is n = 49. What does the sampling distribution of the sample mean look like?
Probability M is Within 2 Standard Errors of m What proportion of all M values are between 94 and 106? To answer this question, you convert these values into z-scores. Now 94 in terms of the M graph is equivalent to z = -2.00, and 106 is located at z = +2.00. How much area is between z = -2.00 and z = +2.00? According to a z-table for probabilities, it is .4772 + .4772 = .9544. So the chance of randomly selecting a M value that is between 94 and 106 is 95.44%.
Generic Formula to Estimate m Notice that 94 is 2 standard errors below the mean of 100 and that 106 is 2 standard errors above the mean of 100. For any scenario where we know the sampling distribution is normal, we could be certain that a little more than 95% of all sample mean values are less than 2 standard errors away from the population mean. In other words, 95.44% of all M values are between and . Why is this important?
Distance Between the M and m For any of these 95.44% of sample mean values, what do you know about the distance between the sample mean value and the population mean? But notice, this tells me that if I have one of these 95.44% of sample means, and I go 2 standard errors on either side of the sample mean, I will have the value of the population mean in that interval! In other words, I have a 95.44% chance that m is between the values and .
Difficulty with This Formula In most cases, s is unknown. Substitute s for s, but this creates t-scores instead of z-scores in our formula. Result is the formula: Value of t comes form a table or software. What does the distribution of t-scores look like?
What are T-scores? The t-distribution (Student’s t-distribution, formally) is formed when a sample is taken from a population that is known to follow a normal distribution and the standardizing calculation uses the sample, not the population, standard deviation What does a graph of t-scores look like? What characteristics are present?
Graph of T-scores The t-distribution (Student’s t-distribution, formally) is similar to a standard normal distribution in that: it is symmetric and mound-shaped it is centered at the mean of 0 However, it is different from the z-distribution in that: t-scores are more variable than z-scores so the t-curve is stretched farther out in the tails, and has less probability in the center at the peak
What is Confidence? Suppose I calculate one 95% confidence interval from a sample and the interval turns out to be (94.5, 106.2) and the value of m is 100. What % of the time is 100 between 94.5 and 106.2? 100% of the time! So what is meant by the term 95% confidence? Recall how we created the interval formula and remember that we based our estimate on the sample we observed.
Meaning of Confidence We know that only 95% of all sample means will be within “t” standard errors of the population mean. Now 95% of all samples will gives us one of these M values. However, 5% of all samples will give us a M value that is more than “t” standard errors from m. So 95% of all the intervals we could form using a certain t-score in the formula will contain m, while 5% of all the intervals we could form will not contain the value of m. For any single interval, it either does or does not contain m.
Trying to Explain the Meaning of Confidence Clearly it is difficult to explain confidence for any single interval. Notice, any single interval either estimates the value of m correctly (hence is 100% correct) or it does not (hence it is 0% correct). The process (forming every possible interval using the formula from before) works correctly 95% of the time (assuming “t” if found to give 95% confidence) and works incorrectly 5% of the time. I suggest not trying to interpret confidence in terms of only one sample. Use a large number of samples.
Large Number of Different Samples Explanation The best option is to use a large number of samples. For example, what does 99% confidence mean? Suppose I took 100,000 samples of n = 50 observations each (so the sampling distribution of M is normal) and made intervals using t = 2.680 with the formula. I would expect about 99,000 of the intervals (that is 99%) to contain the true value of m, while 1,000 intervals would not contain m. Notice for any one interval, I don’t know if it is one of the 99% correct ones or the 1% of incorrect ones.
Confidence Interval Steps by Hand To calculate a confidence interval for m using s: 1. Locate the sample mean, M 2 .Locate the sample standard deviation, s 3. Locate the sample size, n 4. Locate the t-value based on the desired confidence and sample size ( df = n – 1) 5. Find the two endpoints of the interval and 6. Give an interpretation (see next slide) 7. Be sure the interval is valid (see later slide)
Interpreting a Confidence Interval and Validity To interpret a confidence interval, you should include 3 parts: (1) the level of confidence in your statement, (2) the parameter you are estimating, and (3) the values of the interval. General format for now: With 95% confidence, I estimate the mean “fill in the scenario for this population” is between “lower value” and “upper value”.
Validity of a Confidence Interval A confidence interval will be valid using this formula if: 1. a random sample is taken from the population 2. the population standard deviation, s, is unknown so we are using s 3. the sampling distribution of the mean (M) is normal (approximately at least). Recall this is true when either (i) n is at least 30 or (ii) the population from which the sample is taken is normally distributed
Example of a Confidence Interval A bank manager would like to estimate the mean savings account balance for all savings accounts at her bank. She randomly selects 50 accounts and observes the balances. For these 50 accounts, the mean balance is $2135. She also calculates the standard deviation of these 50 account balances to be $820. Using 99% confidence, provide the bank manager with the information she seeks. Assume t = 2.680 Notice we are estimating a population mean, specifically m which is the mean balance for all savings accounts (the population) at her bank. Also s is unknown, but we have calculated s to be $820.
The Confidence Interval and Interpretation M = $2135 s = $820 n = 50 balances and t = 2.680 (from 99% confidence and df = 49) (1824.21, 2445.79) Note: the plus/minus symbol is shorthand. Once you do the calculation with the subtraction, then do it with an addition. This gives the two endpoints of your interval. Interpretation: With 99% confidence, I estimate the mean balance in all savings accounts at this bank to be between $1824.21 and $2445.79.
Is the Confidence Interval Valid? To see if the interval is valid, remember to check for the 3 requirements: 1. a random sample was selected 2. s is unknown so we use s = $820 3. n = 50 balances is at least 30 Yes, the confidence interval is valid. One final note – the interpretation is a reference to the population mean, hence the highlighted word “all” in my interpretation. We always estimate parameters.