Download
1 / 6
60 likes | 238 Views
b. a. RANK-Fc. 140. 120. 100. 80. 60. RANK-Fc (ng/ml). 40. 18S. 20. 0. pcDNA3.1. RANK-Fc. d. **. 0.6. serum. pcDNA3.1. 300. *. 0.5. RANK-Fc. 0.4. 200. number of multinucleated cells. 0.3. 0.2. 100. 0.1. 0. CT. pcDNA3.1. RANK-Fc. 0. 50. 75. 100.

E N D
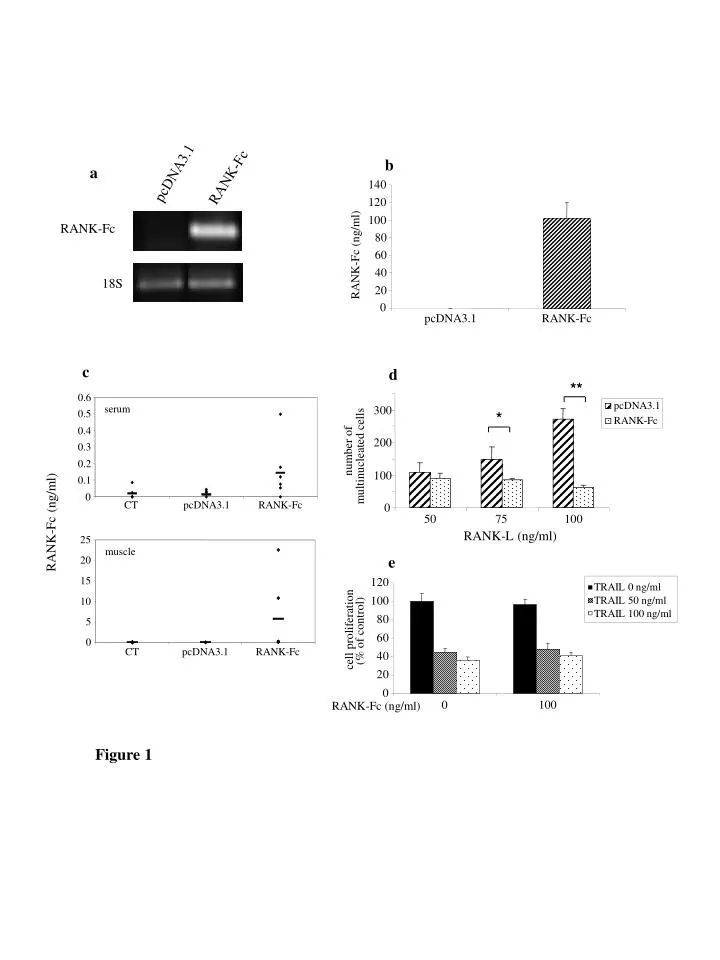
b a RANK-Fc 140 120 100 80 60 RANK-Fc (ng/ml) 40 18S 20 0 pcDNA3.1 RANK-Fc d ** 0.6 serum pcDNA3.1 300 * 0.5 RANK-Fc 0.4 200 number of multinucleated cells 0.3 0.2 100 0.1 0 CT pcDNA3.1 RANK-Fc 0 50 75 100 RANK-L (ng/ml) 25 muscle 20 15 10 5 0 CT pcDNA3.1 RANK-Fc pcDNA3.1 RANK-Fc c RANK-Fc (ng/ml) e 120 TRAIL 0 ng/ml 100 TRAIL 50 ng/ml TRAIL 100 ng/ml 80 cell proliferation (% of control) 60 40 20 0 RANK-Fc (ng/ml) 100 0 Figure 1
pcDNA3.1 RANK-Fc a POS-1 CT b pcDNA3.1 RANK-Fc pcDNA3.1 RANK-Fc CT CT POS-1 POS-1 c Figure 2
* * b * 6000 (day 12-21) 4000 tumor progression 2000 0 CT pcDNA3.1 RANK-Fc a CT 10000 m1=4504 i1= 6/6 6000 2000 0 3 10000 pcDNA3.1 m2=4272 i2= 6/6 c tumor volume (mm ) 6000 2000 0 10000 RANK-Fc m3=1652 i3= 2/6 6000 * 2000 0 15 5 0 10 20 25 days post-implantation Figure 3
50 40 30 OcS/TBIS (%) 20 10 0 pcDNA3.1 RANK-Fc a tumor tumor bone bone pcDNA3.1 pcDNA3.1-sRANK b Figure 4
RANK-Fc 100 ng/ml 120 RANK-Fc 50 ng/ml 100 80 proliferation (% of control) 60 40 20 0 24 48 72 time (hours) 60 50 40 30 Caspase-3 activity (AU) 20 10 0 CT + CT - 24 h 48 h 72 h RANK-Fc (100 ng/ml) a c CT 32 G0: 1% G1: 62 % S: 10 % G2/M: 27 % G0 G1 events S G2/M 0 FL2-A 1023 0 b 32 RANK-Fc G0: 2% G1: 64 % S: 10 % G2/M: 24 % G0 G1 events S G2/M 0 0 1023 FL2-A Figure 5
120 100 80 60 survival rate (%) CT 40 pcDNA3.1 20 RANK-Fc 0 0 10 20 30 40 50 60 days post-POS-1 cell injection Figure 6