Download
1 / 45
490 likes | 900 Views
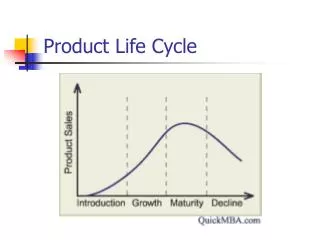
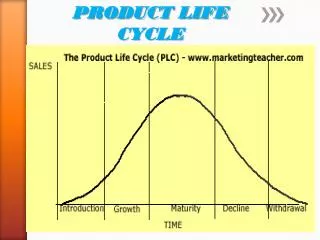
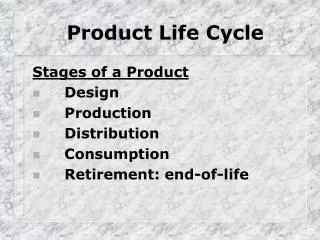
Product Life Cycle. Ken Homa. © K.E. Homa 2000. Time. Product Life Cycle. Maturity. Growth. Decline. Introduction. Product Life Cycle. Typical pattern, highly varied broadly representative product, brand, geography not necessarily predictive instructive, not definitive

E N D
Product Life Cycle Ken Homa © K.E. Homa 2000
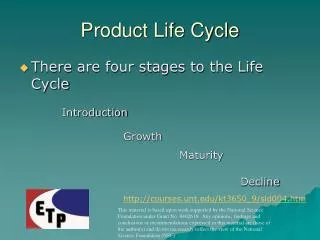
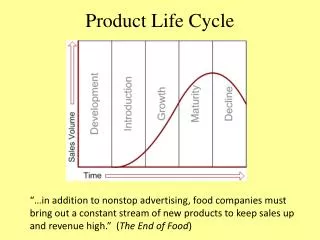
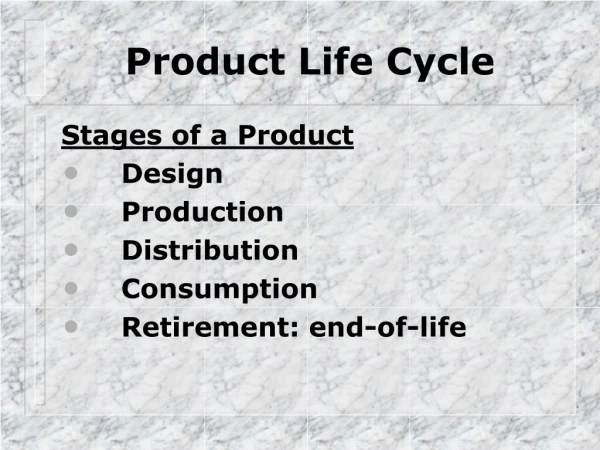
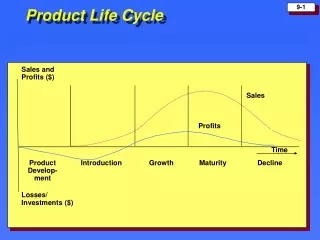
Time Product Life Cycle Maturity Growth Decline Introduction
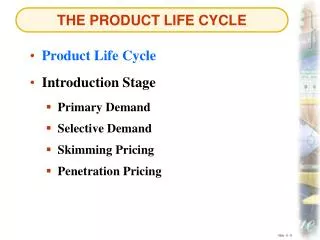
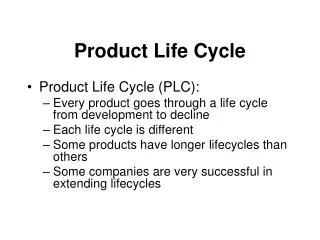
Product Life Cycle • Typical pattern, highly varied • broadly representative • product, brand, geography • not necessarily predictive • instructive, not definitive • conceptually based:diffusion, tech adoption
Diffusion Models • Innovators (First in) • Motivated by market knowledge • Imitators (Followers) • Motivated by interpersonal influences
Simplified Diffusion Model Innovation Rate Initial Innovators Initial Potential Initial Buyers
Simplified Diffusion Model Innovation Rate Total Market Potential New Innovators Remaining Potential New Buyers Already Bought
Simplified Diffusion Model Innovation Rate Total Market Potential New Innovators Remaining Potential New Buyers Already Bought New Imitators Imitation Rate
Innovation Rate Total Market Potential New Innovators Remaining Potential New Buyers Already Bought New Imitators Imitation Rate Simplified Diffusion Model
Total Market Potential Remaining Potential Already Bought Momentum Factor New Buyers Total Market Potential Current Imitation Rate New Buyers Rate Imitation Rate Innovation Rate Bass Diffusion Model
Bass Diffusion Model Illustrative Penetration Pattern ASSUMPTIONS Market Potential = 1000 Innovation Rate = 10% Imitation Rate = 33%
Bass Diffusion Model Illustrative Buying Pattern 150 TOTAL BUYERS ASSUMPTIONS Market Potential = 1000 Innovation Rate = 10% Imitation Rate = 33% 100 IMITATORS 50 INNOVATORS 0 1 2 3 4 5 6 7 8 9 10
34% Early majority 34% Late majority 13.5% 2.5% Innovators 16% Laggards Early adopters Time of adoption of innovations Technology Adoption Life Cycle Adapted from Geoffrey Moore, Crossing the Chasm
Product Life Cycle • Typical pattern, conceptually based • Cash flow critical • Mature ‘lend’, growing ‘borrow’ • Direct link to portfolio strategy
Maturity Sales Growth Decline Introduction Profit Loss Loss Product Life Cycle
Maturity Sales Growth Decline Introduction Product Life Cycle Profit Loss Loss
Product Life CycleCash Flow Summary Net Income Cash Flow from Operations and Investments Intro- duction Growth Maturity Decline Investment Intro- duction Maturity Decline Growth Intro- duction Growth Maturity Decline
Business Portfolio => Cash Flow Growth Businesses Intro Businesses External Financing CASH Declining Businesses Mature Businesses
Growth Introduction High Develop or Withdraw Invest/Grow Inflow Market Attractiveness CashFlowPosition Harvest/ Divest Outflow Earn/Protect Low Mature Decline High Low Relative Business Strength HighCost LowCost Competitive Cost Position Linking PLC & Business Portfolio
Product Life Cycle • Typical pattern, diffusion based • Cash flow critical, portfolio linked • Manageable …
PLC Management Maturity Growth Decline Introduction
PLC Management Maturity Growth Decline Introduction Faster
PLC Management Maturity Growth Decline Higher Introduction Faster
PLC Management Maturity Longer Growth Decline Higher Introduction Faster
PLC Management Maturity Longer Growth Decline Higher Introduction Faster More profitably …
PLC Management Maturity Longer Growth Decline Higher Introduction Faster Tactical differentiation Competitive positioning Strategic regeneration Crossing the Chasm
Managing the PLC • Tactical differentiation • Competitive positioning • Strategic regeneration • Crossing the Chasm
Differentiated PLC Management Management Focus Strategy Class Investment Policy Strategic Role Market position 1st Mover ? Introduction Phased/Selective Establish a profitable position or cut losses Sales/Share Installed base Growth Aggressive Provide future cash flow base Profitable Share Maturity As needed to protect profits (cost reduction, line extensions, etc.) Generate current cash needs Profits/Cash Last in ? Decline Highly Restrictive Maximize short-term profits; contain losses
Industry Weak Competitor Product Life CycleCompetitive Positioning Strong Competitor First Mover, or Predatory Follower Last In …
Product Life CycleRegeneration “Natural” Evolution
Product Life CycleRegeneration “Induced” Regeneration “Natural” Evolution
Mkt A Mkt B Mkt D Mkt C Product Life CycleRegeneration
Mkt A Mkt B Mkt D Mkt C Product Life CycleRegeneration
386 Product Life CycleRegeneration - Intel
486 386 Product Life CycleRegeneration - Intel
486 386 Product Life CycleRegeneration - Intel Pentium
Product Life CycleRegeneration - Intel Pentium 486 386
Established Technology Innovator’s Dilemma
Established Technology Innovator’s Dilemma Disruptive Technology
Established Technology Innovator’s Dilemma Disruptive Technology
Disruptive Technology Established Technology Innovator’s Dilemma
Disruptive Technology Established Technology Innovator’s Dilemma Why upstarts and not established players?
Disruptive Technology Established Technology Innovator’s Dilemma Why upstarts and not established players? High dependency on existing customers Initial market too small (relative to current) Uncertain potential, certain consequences
“Immature” solution No “killer application” 34% Early majority 34% Late majority 13.5% 2.5% Innovators 16% Laggards Early adopters Time of adoption of innovations “Crossing the Chasm” C h a s m
Product Life Cycle • Typical pattern, highly varied • broadly representative • product, brand,geography • not necessarily predictive • instructive, not definitive • conceptually based:diffusion, tech adoption • Cash flow critical • Mature ‘lend’, growing ‘borrow’ • Directlink to portfolio strategy • Manageable … • Differentiated tactics • Competitive positioning • Strategic regeneration • Crossing the Chasm