Download
1 / 4
40 likes | 144 Views
Bharat Book introduces a report "Prepared Soup in Finland (2012) - Market Sizes". Included with this snapshot is socio-economic data for Finland. Population, Consumer Price Index (CPI), Gross Domestic Product (GDP), Exchange Rates.

E N D
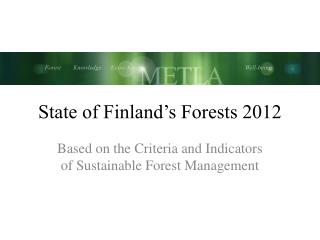
Prepared Soup in Finland (2012) - Market Sizes Bharat Book Bureau
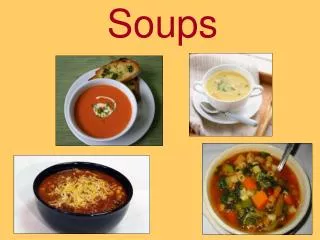
Summary Prepared Soup in Finland provides you with annual year-end market size data, most recently updated in 2012. This comprises packaged dry and wet ambient, wet chilled and wet frozen prepared soups which need no added ingredients other than water. It includes instant soups and soup mixes but excludes noodles soups, stocks and gravies. Market size comprises sales through all retail channels including direct to consumer. Volume and value sales are based on wet soup equivalents. Market size for Prepared Soup in Finland is given in %, EUR, USD and tonnes with a minimum of five years' historical data. Market Forecast is provided for five years. Included with this snapshot is socio-economic data for Finland. Population, Consumer Price Index (CPI), Gross Domestic Product (GDP), Exchange Rates. DescriptionSegmentation of this market Dry - Ambient Wet - Ambient Wet - Chilled Wet - Frozen
Table of Contents: Market size Highlights - strongest and weakest performers Figure 1: Volume - Absolute size (2007 - 2016) Figure 2: Volume - Growth (2007 - 2016) Table 1: Volume (2007 - 2016) Figure 3: Value in Local Currency - Value (2007 - 2016) Figure 4: Value in Local Currency - Value growth (2007 - 2016) Table 2: Value in Local Currency (2007 - 2016) Figure 5: Value in USD - Value (2007 - 2016) Figure 6: Value in USD - Value growth (2007 - 2016) Table 3: Value in USD (2007 - 2016)
For more information: Bharat Book Bureau Phone : +91 22 27810772, 27810773 Fax : +91 22 27812290 E-mail : info@bharatbook.com Website : www.bharatbook.com • Kindly click on : • http://www.bharatbook.com/market-research-reports/food-market-research-report/prepared-soup-in-finland-2012-market-sizes.html • Or visit