Download
1 / 59
610 likes | 712 Views
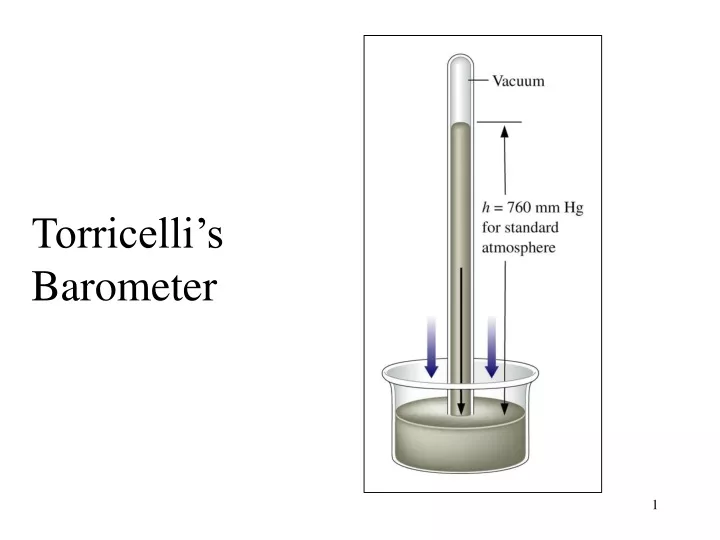
Torricelli’s Barometer. A simple manometer for measuring gas pressure in a container. Robert Boyle. A J-tube similar to the one used by Boyle. Increased pressure leads to decreased volume. Table 5.1 Actual Data from Boyle's Experiment. Plotting Boyle's Data.

E N D
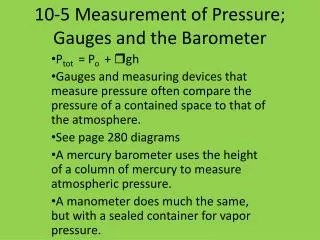
A simple manometer for measuring gas pressure in a container
Antoine and Marie Lavoisier (Painting by Jacques-Louis David)
Empress Eugenie of France (Painting by Franz Winterhalter)
Increasing the temperature of a gas (at constant pressure) increases its volume.
At constant volume, pressure increases in proportion to Kelvin temperature.
Boyle’s law: PV = k (for constant T)Charles’s law: V = kT (for constant P)Gay-Lussac’s law: P = kT (for constant V)COMBINE ALL THREE:PV = k T or PV/T = k for any sample
PV = PVT T (for any sample of gas under two sets of conditions)
One mole of any gas at S.T.P. (273 K, 1.0 atm.) occupies 22.4 L and just fits into this box
At a given temperature and pressure, each of these balloons holds the same number of moles.
The partial pressure of each gas in a mixture depends on the number of moles of that gas.
PV = n RT R = 0.0821 L atm / mol K
Kinetic molecular theory models gases as large numbers of randomly moving particles of negligible volume that interact with other particles (and container walls) only by collision.
NH3 gas and HCl gas diffuse toward each other and react to form solid NH4Cl
Velocity distribution of N2 molecules at 3 different temperatures
Gas at low concentration has relatively fewer interactions between particles
The volume taken up by the gas particles themselves is less important (a) at low pressure than (b) at high pressure.
The pressure exerted by the atomsphere can be demonstrated by boiling water in a large metal can
Schematic diagram of the process for “scrubbing” sulfur dioxide emissions from stack gases in power plants
Variation of temperature (blue) and pressure (dashed lines) with altitude