Download
1 / 27
280 likes | 286 Views
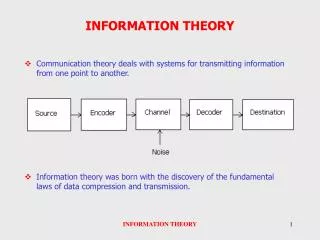
Information Theory and Learning. Tony Bell Helen Wills Neuroscience Institute University of California at Berkeley. One input, one output deterministic Infomax: match the input distribution to the non-linearity:. Gradient descent learning rule to maximise the transferred information.

E N D
Information Theory and Learning Tony Bell Helen Wills Neuroscience Institute University of California at Berkeley
One input, one output deterministic Infomax: match the input distribution to the non-linearity:
Gradient descent learning rule to maximise the transferred information deterministic sensory only
Examples of score functions LOGISTIC LAPLACIAN In stochastic gradient algorithms (online training), we dispense with the ensemble averages giving: for a single training example and a laplacian ‘prior’.
Same theory for multiple dimensions: fire vectors into the the unit hypercube uniformly: ( ) where this is the absolute determinant of the Jacobian matrix, measuring how stretchy the mapping is for square or overcomplete transforms Undercomplete transformations are not invertable, and require the more complex formula:
Same theory for multiple dimensions: fire vectors into the the unit hypercube uniformly: ( ) Post-multiplying this by a positive definate transform rescales the gradient optimally (called the Natural Gradient - Amari) giving the pleasantly simple form:
Decorrelation is not enough: diagonal matrix f gives higher order statistics, through its Taylor expansion
Infomax/ICA on image patches: learn co-ordinates for natural scenes. In this linear generative model, we want u = s: recover independent sources. After training, we calculate A = W , and plot the columns. For 16x16 images, we get 256 bases -1
f from logistic density
f from laplacian density
f from Gaussian density
But this does not actually make the neurons independent. Many joint densities p(u1,u2) are decorrelated but still radially symmetric: they factorise in polar co-ordinates, but not in cartesian, unless they’re Gaussian.. instead of This happens when cells have similar position, spatial frequency, and orientation selectivity, but different phase. Dependent filters can combine to make non-linear complex cells (oriented but phase insensitive).
‘Dependent’ Component Analysis. First, the maximum likelihood framework. What we have been doing is: Infomax Maximum Likelihood Minimum KL Divergence We are fitting a model to the data: or equivalently: But a much more general model is the ‘energy-based’ model (Hinton): sum of functions on subsets of with
‘Dependent’ Component Analysis. For the completely general model: the learning rule is: with the 2nd term reducing to -I (identity) in the case of ICA. Unfortunately this involves an intractable integral over the model q. Nonetheless, we can still work with all dependency models which are non-loopy hypergraphs. Learn as before, but with a modified score function: : a loopy hypergraph: instead of
For example, we can split the space into subspaces such that the cells are independent between subspaces and dependent within the subspaces. Eg: for 4 cells: 1 3 2 4 We now show a sequence of symmetry-breaking occuring as we move from training, on images, a model which is one big 256-dimensional hyperball, down to a model which is 64 four-dimensional hyperballs:
Logistic Density 1 subspace
Logistic density 2 subspaces
Logistic density 4 subspaces
Logistic density 8 subspaces
Logistic density 16 subspaces
Logistic density 32 subspaces
Logistic density 64 subspaces
Topographic ICA Arrange the cells in a 2D map with a statistical model q constructed from overlapping subsets. This is a loopy hypergraph, an un-normalised model, but it still gives a nice result…. The hyperedges of our hypergraph are overlapping 4x4 neighbourhoods etc.
That was from Hyvarinen & Hoyer. Here’s one from Osindero & Hinton.
Conclusion. Well, we did get somewhere: We seem to have an information-theoretic explanation of some properties of area V1 of visual cortex: -simple cells (Olshausen &Field, Bell & Sejnowski) -complex cells (Hyvarinen & Hoyer) -topographic maps with singularities (Hyvarinen & Hoyer) -colour receptive fields (Doi & Lewicki) -direction sensitivity (van Hateren & Ruderman) But we are stuck on: -the gradient of the partition function -still working with rate models, not spiking neurons -no top-down feedback -no sensory-motor (all passive world modeling)
References. The references for all the work in these 3 talks will be forwarded separately. If you don’t have access to them email me at tbell@berkeley.edu, and I’ll send them to you.