Download
1 / 35
370 likes | 526 Views
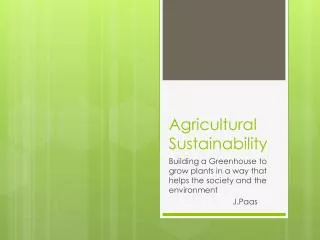
Agricultural Sustainability: Opportunities for contributions from computational sciences. Laurie Drinkwater Cornell University. Solving a complex equation, by Owen Schuh. Overview of this talk. Context Global situation in terms of food, hunger and environmental change

E N D
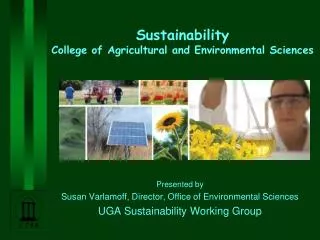
Agricultural Sustainability: Opportunities for contributions from computational sciences Laurie Drinkwater Cornell University Solving a complex equation, by Owen Schuh
Overview of this talk • Context • Global situation in terms of food, hunger and environmental change • Transitioning to sustainable agricultural systems • What are the challenges that must be addressed? • Ideology and values play a role in defining sustainable agriculture • Social-ecological systems: A useful conceptual framework • Potential questions for computational sciences • Three examples
Global food situation • Nearly 900 million people -- about 13% of the world population -- do not have enough food (FAO) • About 40% of the world population relies on subsistence agricultural systems • Currently, we have sufficient food for our population– political and economic conditions prevent access • Can food production continue to keep pace with population growth?
Humans occupy 75% of the ice-free terrestrial surface and manage 90% of the NPP • Agricultural systems dominate a majority of the most productive biomes Ellis and Ramankutty 2008
Consequences of intensification • Resource consumption by industrial agriculture is enormous and is undermining long term productivity of our agricultural lands. • Fossil fuels, water, soil, land area • Agricultural systems disrupt the integrity of natural ecosystems and contribute to widespread losses of biodiversity. • Movement of nutrients, toxic chemicals and sediments • Extensive land use • Agriculture is a major contributor to global climate change. • 52% and 84% of global anthropogenic CH4 and N2O, significant C02 • Despite progress in food output on a per acre and per capita basis, the quality of life for farm families and rural communities continues to decline. • Reduced income over time, health issues
Human activities and environmental consequences are changing rapidly Steffan et al. 2004. Global Change and the Earth System.
Transitioning to sustainable agricultural systems http://waterweek.wordpress.com/2007/09/19/
Ecosystem Services The benefits people obtain from ecosystems Millennium Ecosystem Assessment- www.millenniumassessment.org
What are our goals for agriculture? • Multifunctional: Food and fiber plus ecosystems services • Provide healthy, nutritional food in sufficient quantities • Production and food systems must be resilient • Quality of life for farm families and vibrant rural communities • Reverse environmental degradation: local to global scales
Super eco http://www.holocene.net/
Agriculture as a social-ecological system • Food production is still largely dependent on ecological processes despite intensification • Social processes govern the design and development of production systems and agricultural technology as well as land use patterns • So far, social processes have not proven to be adept at responding to ecosystem change or mitigating undesirable consequences
EU: DPSIR Framework Pressure on the environment State of the environment changes Social and economic Driving forces Societal Response Impacts on human health, [Impacts on other species or undermining Ecosystem Services(?)]
Ecosystem modeling—Flows of energy and materials Resource accounting– Ecological footprint and life cycle analysis Spatial and temporal analysis of existing (massive) data sets What areas could benefit from computer science and mathematics? Three examples…
Ecosystem modeling Ecosystem process models have five components • Forcing functions or external variables-naturally imposed variables that influence the state of the ecosystem • State variables-variables that describe the state of the ecosystem • Mathematical equations-represent biological, chemical and physical functions and describe the relationship between forcing functions and state variables • Parameters-coefficients in the mathematical representation of processes • Universal constants-naturally occurring constants Jorgensen and Bendoricchio 2001
ecological drivers Climate Soil Vegetation Human activity annual average temp. litter water uptake potential evapotrans. very labile labile resistant N-demand N-uptake water stress daily growth root respiration water demand microbes LAI-regulated albedo evap. trans. labile resistant vertical water flow humads labile resistant grain stems roots soil moist profile soil Eh profile O2 diffusion soil temp profile O2 use Plant growth passive humus Soil climate Decomposition effect of temperature and moisture on decomposition soil environmental factors Temperature Moisture pH Eh Substrates: NH4+, NO3-, DOC nitrate denitrifier nitrite denitrifier N2O denitrifier DOC soil Eh nitrifiers DOC NH4+ NH3 NO3- DOC NO3- NH4+ NO2- DOC CH4 transport CH4 oxidation CH4 production clay- NH4+ aerenchyma CO2 N2O NO NH3 N2 N2O CH4 NO Denitrification Nitrification Fermentation The Decomposition-Denitrification Model
Modeling flows of energy and materials Water drainage from watersheds planted with corn and soybean on tile-drained Mollisols in Illinois Graph courtesy of Christina Tonitto
Comparison of six widely used process models: Daily N2+N2O flux predictions across models • Models had different predictions for water flux, soil moisture status • They also had very different seasonal predictions of N gas flux • With limited field data we can not distinguish which model perform best • Options for resolving this: massive data collection and increased complexity of models • Can we develop simple models to serve need of policymakers? • Can we combine spatial and process modeling? David et al. 2009
The Ecological Footprint • Developed by Wackernagel and Rees, 1996: Our Ecological Footprint: Reducing Human Impact on the Earth • Attempts to answer a single question: How much of the planet’s capacity do we use compared to how much is available? • Compares the area we demand to how much area is available • Currently, it provides the only available comprehensive answer to this research question. • Based on real data: consumption and production • How does this approach differ from carrying capacity?
Global ecological footprint by component, 1961-2005 http://www.footprintnetwork.org Living Planet Report 2008
Ecological Footprint per person, by country for 2005 http://www.footprintnetwork.org Living Planet Report 2008
Ecological Footprint summary • Provides insights on sustainability of natural capital use at large scales: regions, nations and global • Example: Because the calculations are based on actual consumption rates that reflect current technology, we can conclude that technology has not kept pace with increased consumption • Limitations in terms of env. Impact of toxins, materials that do not decompose, and resource depletion outside the biosphere • Strong ecological basis: datasets and calculation methods have improved since 1996 • Focus on natural capital, efficiency of providing human needs • Does not assess social indicators of sustainability • Application to farm-scale production has yet to be clearly demonstrated but has the potential to be very useful in combination with other approaches
Life cycle assessment • Developed in the 1960’s, “industrial ecology” • A “cradle-to-grave” approach for assessing industrial systems. • Begins with the gathering of raw materials from the earth to create the product and ends at the point when all materials are returned to the earth. • Quantifies environmental releases to air, water, and land in relation to each life cycle stage and/or major contributing process in the course of the product’s life-span
LCA of three contrasting pig production systems Van der Werf et al. 2003
LCA summary • Focus is on assessing natural capital: source-sink and environmental impacts • Integrates known environmental impacts • Interpretation of trade-off across env. Impacts depends on subjective decision-making of the evaluators • Sound ecological basis but estimating emissions in agricultural systems presents a formidable challenge (open versus point emissions) • Units for reporting resource use and emissions determine performance of contrasting systems
Intensification of the landscape continues to increase: loss of winter annuals David et al, in prep.
Crop distribution in Illinois, 2004 Corn Soybean Pasture There is a vast amount of biophysical and social data available. USDA and Census Bureau, NRCS
Understand spatial patterns and temporal dynamics of agricultural landscapes Average N loss at a county level in the Mississippi River Basin Mark David et al., in prep
Conservation payments are lowest in the high yielding regions
Conclusions • Tremendous potential for computational sciences to contribute • Vast amounts of information are not being exploited to their full potential • The pace of change presents a significant challenge • Quantitative analysis of systemic trends can help society adapt and respond appropriately to environmental change