Download
1 / 20
200 likes | 460 Views
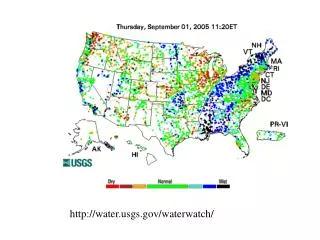
http://water.usgs.gov/waterwatch/. Stream Flow Measurement: Velocity-Area method Stream discharge = Q = U * A Q = volumetric flow rate in [L 3 T -1 ] U= average stream velocity [L 2 T -1 ] A = cross sectional area of stream flow (perpendicular to the direction of flow) [L 2 ].

E N D
Stream Flow Measurement: Velocity-Area method Stream discharge = Q = U * A Q = volumetric flow rate in [L3 T-1] U= average stream velocity [L2 T-1] A = cross sectional area of stream flow (perpendicular to the direction of flow) [L2]
In wide, strait streams with a moderate amount of turbulence, the change of velocity with depth generally follows a logarithmic velocity profile. u(yi) = 1 u*i ln (yi/yoi) k u(yi) = velocity at distance yi above the stream bottom at vertical i k = von Karmen’s constant = 0.4 u*i = shear velocity = (g Yi Sc)1/2 yoi = roughness height
With a logarithmic velocity profile, velocity at 0.368 of the total water depth (distance above the bottom, or 0.632 of the depth measured from the surface) equals the average stream velocity. For shallow stream segments, the USGS will measure velocity at 0.6 of the depth measured from the surface and consider this the average water velocity. The average stream velocity can also be determined from the average of the velocities measured at 0.2 and 0.8 of the depth. This approach is used in water deeper than 0.75 m. When stream flow gauging, USGS divides the stream width into segments and then typically measures velocity and calculates cross sectional area for each width segment The flow within the segment is the average velocity times the cross sectional are of the segment, and the total flow in the stream is the sum of the flows calculated in each segment. Stream discharge = Q = U * A Q = Ui Ai U = A/Q
Current meters for measuring stream velocity
These stream flow measurements are conducted approximately every 6 weeks, and special effort is made to obtain such measurements during very high flow events. If the stream channel shape is relatively stable, a consistent relationship between stream flow and water depth is often observed. Stream depth is monitored continuously, and the relationship between depth and discharge (rating curve) is used to estimate stream flow. The vast majority of stream discharge reported by USGS depends on a rating curve. Boneyard Creek Rating Curves
Monitoring Water surface elevation (or stage) can be measured by several techniques: Float and pulley Pressure methods: Bubbler Transducer Ultrasonic
Problems with the Rating Curve Approach: Discharge at the highest flow depths is often based on extrapolation because such flows are rare and it is difficult to make many velocity measurements during such events. At very low flows in wide shallow streams, it is difficult to make accurate velocity measurements. The relationship between depth and flow is often different depending upon whether flow is increasing or decreasing. This is sometimes called hysteresis in the stage- discharge curve because the relationship depends on the recent history of measurement. This is caused by there being higher velocities in rising flow and lower velocities in declining flow. When hysteresis leads to large errors, it can be addressed by measuring depth at two different locations and the rating curve becomes a function of both depth at one location and the difference in depth at the two locations. In rivers affected by tides, or backflow from larger rivers it is also necessary to measure depth at two different points to correct for the influence of these effects.
Rating curves may change when significant change occurs in the geometry of the stream channel or if an obstruction to flow is introduced or removed. Log jams, ice jams, beaver dams may cause temporary deviations from a rating curve. Erosion of streambed or banks, sediment deposition, stream dredging or major construction in a stream or flood plain can cause permanent changes in a rating curve and a new rating curve may need to be established. In order to avoid frequent changes in rating curves from erosion or deposition, USGS attempts to locate flow gauging stations in places where the streams are relatively stable.
Dilution Gauging