Download
1 / 1

E N D
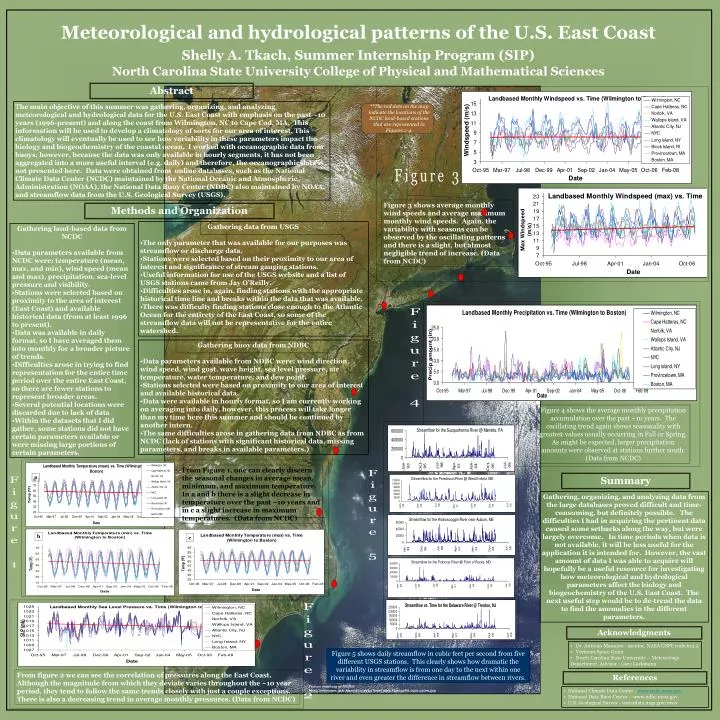
Figure 4 shows the average monthly precipitation accumulation over the past ~10 years. The oscillating trend again shows seasonality with greatest values usually occurring in Fall or Spring. As might be expected, larger precipitation amounts were observed at stations further south. (Data from NCDC) Meteorological and hydrological patterns of the U.S. East Coast Shelly A. Tkach, Summer Internship Program (SIP) North Carolina State University College of Physical and Mathematical Sciences Abstract **The red dots on the map indicate the locations of the NCDC land-based stations that are represented in Figures 1-4. The main objective of this summer was gathering, organizing, and analyzing meteorological and hydrological data for the U.S. East Coast with emphasis on the past ~10 years (1996-present) and along the coast from Wilmington, NC to Cape Cod, MA. This information will be used to develop a climatology of sorts for our area of interest. This climatology will eventually be used to see how variability in these parameters impact the biology and biogeochemistry of the coastal ocean. I worked with oceanographic data from buoys, however, because the data was only available in hourly segments, it has not been aggregated into a more useful interval (e.g. daily) and therefore, the oceanographic data is not presented here. Data were obtained from online databases, such as the National Climate Data Center (NCDC) maintained by the National Oceanic and Atmospheric Administration (NOAA), the National Data Buoy Center (NDBC) also maintained by NOAA, and streamflow data from the U.S. Geological Survey (USGS). Figure 3 Figure 3 shows average monthly wind speeds and average maximum monthly wind speeds. Again, the variability with seasons can be observed by the oscillating patterns and there is a slight, but almost negligible trend of increase. (Data from NCDC) Methods and Organization • Gathering data from USGS • The only parameter that was available for our purposes was streamflow or discharge data. • Stations were selected based on their proximity to our area of interest and significance of stream gauging stations. • Useful information for use of the USGS website and a list of USGS stations came from Jay O’Reilly. • Difficulties arose in, again, finding stations with the appropriate historical time line and breaks within the data that was available. • There was difficulty finding stations close enough to the Atlantic Ocean for the entirety of the East Coast, so some of the streamflow data will not be representative for the entire watershed. • Gathering land-based data from NCDC • Data parameters available from NCDC were: temperature (mean, max, and min), wind speed (mean and max), precipitation, sea-level pressure and visibility. • Stations were selected based on proximity to the area of interest (East Coast) and available historical data (from at least 1996 to present). • Data was available in daily format, so I have averaged them into monthly for a broader picture of trends. • Difficulties arose in trying to find representation for the entire time period over the entire East Coast, so there are fewer stations to represent broader areas. • Several potential locations were discarded due to lack of data • Within the datasets that I did gather, some stations did not have certain parameters available or were missing large portions of certain parameters. • Gathering buoy data from NDBC • Data parameters available from NDBC were: wind direction, wind speed, wind gust, wave height, sea level pressure, air temperature, water temperature, and dew point. • Stations selected were based on proximity to our area of interest and available historical data. • Data were available in hourly format, so I am currently working on averaging into daily, however, this process will take longer than my time here this summer and should be continued by another intern. • The same difficulties arose in gathering data from NDBC as from NCDC (lack of stations with significant historical data, missing parameters, and breaks in available parameters.) Figure 4 From Figure 1, one can clearly discern the seasonal changes in average mean, minimum, and maximum temperature. In a and b there is a slight decrease in temperature over the past ~10 years and in c a slight increase in maximum temperatures. (Data from NCDC) a Summary Gathering, organizing, and analyzing data from the large databases proved difficult and time-consuming, but definitely possible. The difficulties I had in acquiring the pertinent data caused some setbacks along the way, but were largely overcome. In time periods when data is not available, it will be less useful for the application it is intended for. However, the vast amount of data I was able to acquire will hopefully be a useful resource for investigating how meteorological and hydrological parameters affect the biology and biogeochemistry of the U.S. East Coast. The next useful step would be to de-trend the data to find the anomalies in the different parameters. Figure 5 Figure 1 b c Acknowledgments • Dr. Antonio Mannino - mentor, NASA GSFC code 614.2 • Vermont Space Grant • North Carolina State University – Meteorology Department, Advisor - Gary Lackmann Figure 2 Figure 5 shows daily streamflow in cubic feet per second from five different USGS stations. This clearly shows how dramatic the variability in streamflow is from one day to the next within one river and even greater the difference in streamflow between rivers. From figure 2 we can see the correlation of pressures along the East Coast. Although the magnitude from which they deviate varies throughout the ~10 year period, they tend to follow the same trends closely with just a couple exceptions. There is also a decreasing trend in average monthly pressures. (Data from NCDC) References Picture courtesy of MODIS - http://veimages.gsfc.nasa.gov/5912/EastCoast.A2003286.1550.250m.jpg • National Climate Data Center - www.ncdc.noaa.gov • National Data Buoy Center – www.ndbc.noaa.gov • U.S. Geological Survey - waterdata.usgs.gov/nwis