Download
1 / 60
610 likes | 619 Views
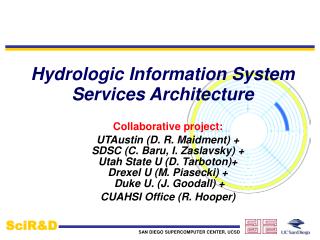
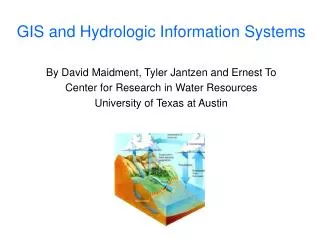
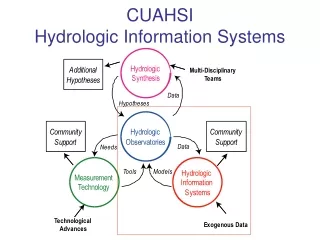
Hydrologic Information Systems. David Maidment, Tim Whiteaker, Dean Djokic, Norman Jones ESRI, Redlands CA Sept 4, 2007. Linking GIS and Water Resources. Water Resources. GIS. Hydrologic Information System. GIS – the water environment. Water Resources – the water itself. Six Demos.

E N D
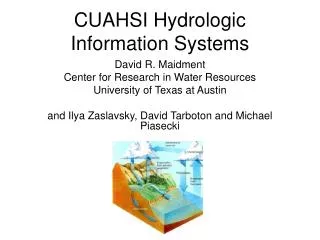
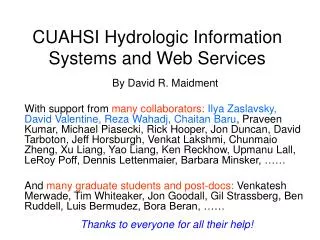
Hydrologic Information Systems David Maidment, Tim Whiteaker, Dean Djokic, Norman Jones ESRI, Redlands CA Sept 4, 2007
Linking GIS and Water Resources Water Resources GIS
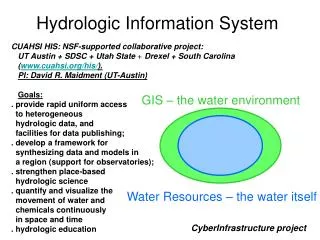
Hydrologic Information System GIS – the water environment Water Resources – the water itself
Six Demos • WaterOneFlow web services in Excel • Data access system for hydrology (DASH) • Semantic mediation using HydroSeek • Arc Hydro for watershed data • Exploratory space-time analysis • Automated water balancing using OpenMI
Six Demos • WaterOneFlow web services in Excel • Data access system for hydrology (DASH) • Semantic mediation using HydroSeek • Arc Hydro for watershed data • Exploratory space-time analysis • Automated water balancing using OpenMI
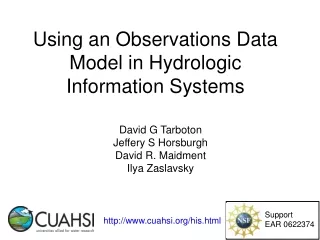
Point Observations Information Model http://www.cuahsi.org/his/webservices.html USGS Data Source GetSites Streamflow gages Network GetSiteInfo Neuse River near Clayton, NC Sites GetVariables GetVariableInfo Discharge, stage (Daily or instantaneous) Variables GetValues Values 206 cfs, 13 August 2006 {Value, Time, Qualifier, Offset} • A data source operates an observation network • A network is a set of observation sites • A site is a point location where one or more variables are measured • A variable is a property describing the flow or quality of water • A value is an observation of a variable at a particular time • A qualifier is a symbol that provides additional information about the value • An offset allows specification of measurements at various depths in water
Locations Variable Codes Date Ranges WaterML and WaterOneFlow STORET Data GetSiteInfo GetVariableInfo GetValues Data NAM NWIS WaterML Data WaterOneFlow Web Service Data Repositories Client EXTRACT TRANSFORM LOAD WaterML is an XML language for communicating water data WaterOneFlow is a set of web services based on WaterML
Set of query functions Returns data in WaterML WaterOneFlow
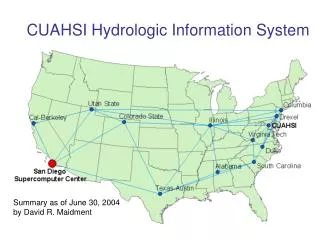
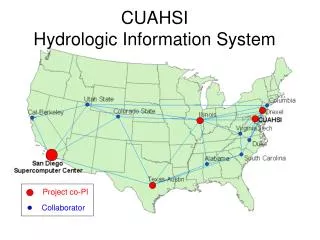
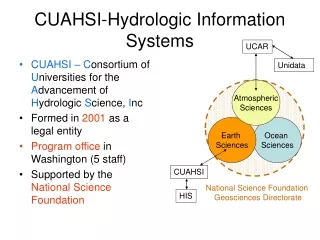
WATERS Network Information System Utah State University HIS Servers National HIS Server at San Diego SuperComputer Center Texas A&M Corpus Christi NSF has funded work at 10 testbed sites, each with its own science agenda. A CUAHSI Hydrologic Information Server is installed at each site.
Global data National data State data Project in region …. Principal investigator data Multiscale Information System
Corpus Christi Bay WATERS Testbed site National Datasets (National HIS) Regional Datasets (Testbed HIS) USGS NCDC TCOON Dr. Paul Montagna TCEQ SERF NCDC station TCOON stations TCEQ stations Hypoxic Regions Montagna stations USGS gages SERF stations
Six Demos • WaterOneFlow web services in Excel • Data access system for hydrology (DASH) • Semantic mediation using HydroSeek • Arc Hydro for watershed data • Exploratory space-time analysis • Automated water balancing using OpenMI
Supports data discovery, delivery and publication Data discovery – how do I find the data I want? Map interface and observations catalogs Metadata based Search Data delivery – how do I acquire the data I want? Use web services or retrieve from local database Data Publication – how do I publish my observation data? Use Observations Data Model Hydrologic Information Server
Observation Stations Map for the US Ameriflux Towers (NASA & DOE) NOAA Automated Surface Observing System USGS National Water Information System NOAA Climate Reference Network
Observations Catalog Specifies what variables are measured at each site, over what time interval, and how many observations of each variable are available
GetSites GetSiteInfo GetVariables GetVariableInfo GetValues Hydrologic Information Server WaterOneFlow services DASH – data access system for hydrology ArcGISServer Geospatial Data Observations Data Microsoft SQLServer Relational Database
Six Demos • WaterOneFlow web services in Excel • Data access system for hydrology (DASH) • Semantic mediation using HydroSeek • Arc Hydro for watershed data • Exploratory space-time analysis • Automated water balancing using OpenMI
Syntactic mediation Heterogeneity of format Use WaterML to get data into the same format Semantic mediation Heterogeneity of meaning Each water data source uses its own vocabulary Match these up with a common controlled vocabulary Make standard scientific data queries and have these automatically translated into specific queries on each data source Data Heterogeneity
request return return request NAWQA request return return request NAM-12 request return NWIS request return request return return request NARR Objective • Search multiple heterogeneous data sources simultaneously regardless of semantic or structural differences between them What we are doing now ….. Michael Piasecki Drexel University
NAWQA NWIS NARR HODM Semantic Mediator What we would like to do ….. GetValues GetValues GetValues GetValues generic request GetValues GetValues Michael Piasecki Drexel University GetValues GetValues
Six Demos • WaterOneFlow web services in Excel • Data access system for hydrology (DASH) • Semantic mediation using HydroSeek • Arc Hydro for watershed data • Exploratory space-time analysis • Automated water balancing using OpenMI
Bringing together these two communities by using a common geospatial data model CRWR GIS CRWR GIS in Water Resources Consortium Water Resources
Arc Hydro: GIS for Water Resources Published by ESRI Press The Arc Hydro data model and application tools are in the public domain
Hydrologic Cycle Components NetCDF in the Atmosphere Arc Hydro for Surface Water Arc Hydro for Groundwater
Data Model Based on Behavior “Follow a drop of water from where it falls on the land, to the stream, and all the way to the ocean.” R.M. Hirsch, USGS
Integrating Data Inventory using a Behavioral Model Relationships between objects linked by tracing path of water movement
San Marcos Basin Flow Accumulation Grid Arc Hydro book, p.73
Six Demos • WaterOneFlow web services in Excel • Data access system for hydrology (DASH) • Semantic mediation using HydroSeek • Arc Hydro for watershed data • Arc Hydro tools (Dean Djokic and ESRI Water Resources Group) • Using Arc Hydro to link NHDPlus, water and weather data • Exploratory space-time analysis • Automated water balancing using OpenMI
Six Demos • WaterOneFlow web services in Excel • Data access system for hydrology (DASH) • Semantic mediation using HydroSeek • Arc Hydro for watershed data • Arc Hydro tools (Dean Djokic and ESRI Water Resources Group • Using Arc Hydro to link NHDPlus, water and weather data • Exploratory space-time analysis • Automated water balancing using OpenMI
NHDPlus – River and Catchment Network for the Nation 2.3 million river reaches and catchments Integration of the National Hydrography Dataset, National Elevation Dataset and National Land Cover Dataset just completed by EPA
Arc Hydro book, p. 61 NHDPlus
Data Cube A simple data model Time, T “When” D “Where” Space, L Variables, V “What”
Continuous Space-Time Model – NetCDF (Unidata) Time, T http://www.daymet.org Coordinate dimensions {X} D Space, L Variable dimensions {Y} Gridded climate data – daily time step, 1 km cells Variables, V
Discrete Space-Time Data ModelArcHydro Time, TSDateTime TSValue Space, FeatureID Variables, TSTypeID
Drainage System Hydro Network Flow Time Time Series Hydrography Channel System Arc Hydro Components HydroID HydroID
Arc Hydro connects geospatial and temporal water resources data Streamflow Arc Hydro NHDPlus Weather
Six Demos • WaterOneFlow web services in Excel • Data access system for hydrology (DASH) • Semantic mediation using HydroSeek • Arc Hydro for watershed data • Exploratory space-time analysis • Automated water balancing using OpenMI
Space-Time Datasets CUAHSI Observations Data Model Sensor and laboratory databases From Robert Vertessy, CSIRO, Australia
Analysis, Modeling, Decision Making Arc Hydro Geodatabase Hydrologic Information System A synthesis of geospatial and temporal data supporting hydrologic analysis and modeling
Water Rights Analysis Package (WRAP) is a simulation model used by the Texas Commission for Environmental Quality WRAP models have been built for all 23 river and coastal basins in Texas They simulate surface water withdrawals at about 10,000 locations where water permits have been issued in Texas Uses monthly time steps and ~ 50 year planning period Visualizing the output of the WRAP model (Clark Siler) Reservoir levels in the Neches basin
Information Products Desired • A WRAP model has about 40 output variables defined at each water permit location and time point • Plot a map showing for a given time pointthe value of a selected variable at each permit location • Plot a map for a given time interval of the average value of a selected variable over that time interval • Plot a graph showing the time variation of an output variable at a selected permit location Read into the geodatabase 500,000 lines of program output in ~ 1 minute
Time Space Time Space Multivariable Table Each space-time point is unique and is associated with a set of variables A set of variables …… Graphs Maps
Six Demos • WaterOneFlow web services in Excel • Data access system for hydrology (DASH) • Semantic mediation using HydroSeek • Arc Hydro for watershed data • Exploratory space-time analysis • Automated water balancing using OpenMI
Project sponsored by the European Commission to promote integration of water models within the Water Framework Directive • Software standards for model linking • Uses model core as an “engine” • http://www.openMI.org
Time, T D Space, L Variables, V OpenMI Conceptual Framework All values are referenced in a what-where-when framework, allowing different data resources or models to communicate data VALUES An application of the data cube to integrate simulation models Jon Goodall, Duke University