Download

1 / 33
480 likes | 1.07k Views
Introduction to Human Factors/Ergonomics (HFE) “Engineering Anthropometry”. Hardianto Iridiastadi, Ph.D. Introduction. Variability in physical dimensions Studied earlier in Anthoropology (study of mankind) Interest in physical aspects (beginning of anthropometry)

E N D
Introduction to Human Factors/Ergonomics (HFE)“Engineering Anthropometry” Hardianto Iridiastadi, Ph.D.
Introduction • Variability in physical dimensions • Studied earlier in Anthoropology (study of mankind) • Interest in physical aspects (beginning of anthropometry) • Later, data are used for biomechanics investigations • The need to design workplaces to accomodate differences in body dimensions
Factors Affecting Anthropometrical Variation Age Gender Race & Ethnic Socio-economics Occupation Life style Circadian Secular trend Measurement
Ergonomic Implications • International markets • Different target countries • Transfer of technology • Job selection • Healthy worker effect • Fit the man to the job
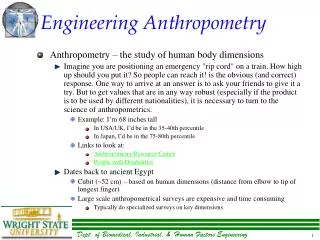
Engineering Anthropometry • “a branch of science originating from anthropology that attempts to describe the physical dimensions of the (human) body” “anthropos” = man “metron’ = measure
Types of Anthropometric Data • Physical (Static) anthropometry – which addresses basic physical dimensions of the body. • Functional anthropometry – concerned with physical dimensions of the body relevant to particular activities or tasks. • Newtonian data – body segment mass data and data about forces that can be exerted in different tasks/postures
Applications • Tools design • Consumer product design • Workplace design • Interior design
Measurement Techniques • Positions • Standing naturally upright • Standing stretched to maximum height • Lean against a wall • Sitting upright • Lying (supine posture) • “Anatomical position” (see Kroemer et al)
Measurement Techniques • Some key measurement terms • Height • Breadth • Depth • Distance • Curvature • Circumference • Reach
Newer Measuring Devices • Photograph • Use of grids • Image processing techniques • Can record all three dimensional aspects • Infinite number of measurements • Drawbacks • Parallax • Body landmarks cannot be palpated
Newer Measuring Devices • Whole body scanner • Ergonomic center UI • $50,000 - $400,000 • Hundreds of variables • Standing and seated posture • Combined with modeling software (Jack, Mannequin, etc.)
Statistics • Coefficient of variation • Data diversity = sd/mean • CV ~ 5% (10% for strength data) • Large CV should be suspected • Standard error of the mean (se) • se = sd/√n • Useful for describing confidence interval • E.g., 95% CI = mean ± 1.96 se
Statistics • Means () and standard deviations () are typically reported for anthropometric data (often separated by gender) • Use of these value implicitly assumes a Normal distribution. Assumption is reasonable for most human data. • Percentiles can easily be calculated from mean and std.dev. using these formulas and/or standard statistical tables (usually z).
Statistics Percentile • Commonly used: 5th, 95th, 50th (median) • Lower-limit dimension: the smaller the system, the more unusable by the largest user Use high percentile • Upper-limit dimension: the bigger the system, the more unusable by smallest user Use low percentile
Statistics - Standard Normal Variate • Z = (y-)/ • Normally distributed with mean = 0 and variance = 1 • z is N(0,1) • From tables of normal cumulative probabilities • P{z≤z(A)} = A • Example: if zA = 2, A = 0.9772 (two std.dev. above mean is the 97.7%-ile) • Properties of z: • zA > 0; above mean (>50%-ile) • zA = 0; at mean (50%-ile) • zA < 0; below mean (<50%-ile)
Percentile Example • For female stature (from Table) • = 160.5 cm • = 6.6 cm • What female stature represents the 37.5th %-ile? • From normal distribution: z(37.5%) = -0.32 Thus, X(37.5%) = + z = 160.5 - (0.32)(6.6) = 158.4 cm
Anthropometric Data: Variances • To combine anthropometric dimension, need to calculate a new distribution for the combined measures, accounting also for the covariance (Cov) between measures (M = mean; S = std. dev.): MX+Y = MX + MY SX+Y = [SX2 + SY2 + 2Cov(X,Y)]1/2 SX+Y = [SX2 + SY2 + 2(rXY)(SX)(SY)]1/2 MX-Y = MX - MY SX-Y = [SX2 + SY2 - 2Cov(X,Y)]1/2 SX-Y = [SX2 + SY2 - 2(rXY)(SX)(SY)]1/2 • Means add, variances do not!
Anthropometrical Design Procedures • Determine dimensions of product which are critical for design (considering effectiveness, safety and comfort) • Determine the related body dimensions • Select user population (who will use the product or workplace) • Conduct reference study to find secondary data, if available (considering population characteristics) or conduct measurement • Select percentile
The “Average Human” • Anthropometric data for individuals is often estimated using stature or body weight in linear regression equations. • Ex: average link lengths as a proportion of body stature • Advantages: • Simplicity • Disadvantages: • relationships are not necessarily linear, nor the same for all individuals • Values represent averages for a portion of a specific population
Anthropometry in Design • Anthropometric data is most often used to specify reach and clearance dimensions. • The criterion values most often used: • Reach: 5% Female • Clearances: 95% Male • Try to accommodate as large as possible user population within constraints
Design Approaches • Design for extremes • emphasize one 'tail' of distribution • Design for average • emphasize the center of a population distribution • Design for adjustability • emphasize that all potential users/consumers are 'equal’ • Varying ranges of accommodation: • 5th-95th %ile: typical • 25th-75 %ile: less critical functions or infrequent use • 1st - 99th %ile: more critical functions +/- low $ • 0.01 - 99.99 %ile: risk of severe outcomes
Design for Extremes • Example: Door Height • Assuming a normal distribution • z = (X - )/ • Obtain z => %-ile from stats table • What height to accommodate? (95th%-ile male) • = 69”; = 2.8” (from anthropometric table) • z0.95 = 1.645 = (X - 69)/2.8 => X = 73.6” • Additional allowances? • Hair • Hats and shoes • Gait • Etc.
Examples Which design strategy should be employed? • leg clearance at a work table • finger clearance for a recessed button • height of an overhead conveyor system • grip size for a power tool • weight of a power tool • height of a conveyor • strength required to turn off an emergency valve
General Strategies and Recommendations • Design for Average: • Usually the worst approach: both larger and smaller users won’t be accommodated • Design for Extremes: • Clearance: use 95th percentile male • Reach: use 5th percentile female • Safety: accommodate >99% of population • Design for Adjustability • Preferred method, but range and degrees of adjustment are difficult to specify
Homework • Working in groups: • Select a workplace near campus. Identify any ‘ergonomic mismatch’. Suggest how the workplace can be better designed from the perspective of engineering anthropometry. You should outline the design approach. • Pick a journal paper that discusses the use of anthropometric data in design. Submit a one-page summary (in Indonesian) of the paper. Also submit softcopy of the paper.