Download
1 / 42
420 likes | 424 Views
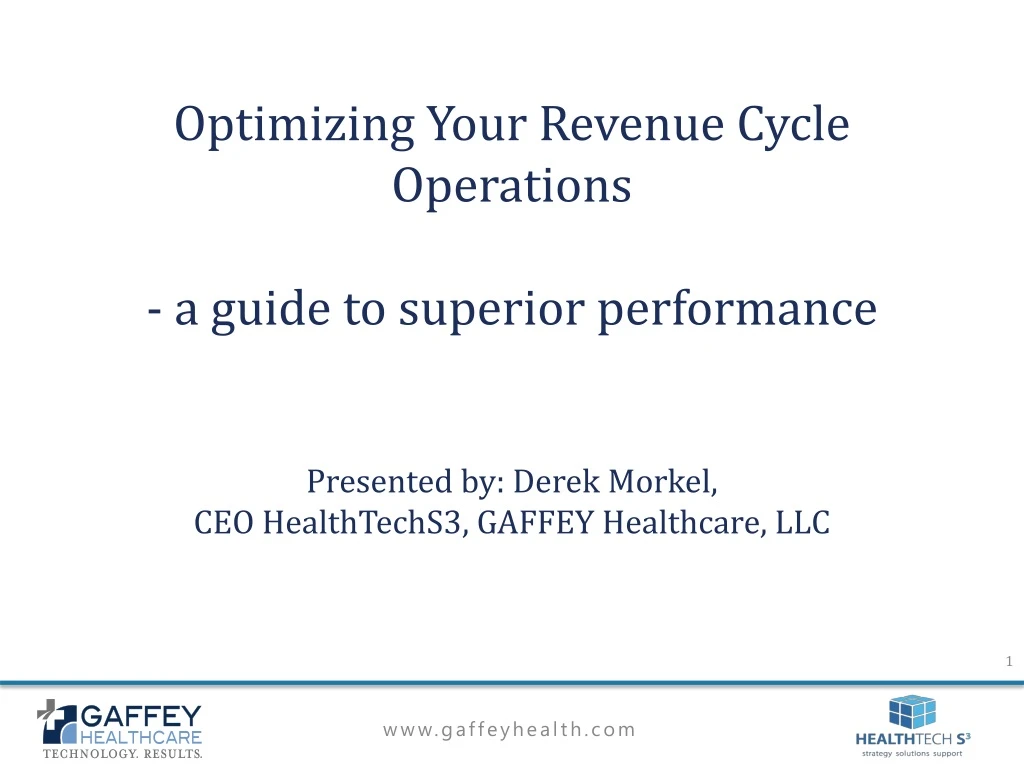
Optimizing Your Revenue Cycle Operations - a guide to superior performance Presented by: Derek Morkel, CEO HealthTechS3, GAFFEY Healthcare, LLC. About HealthTechs3 Strategy – Solutions – Support. 2. GAFFEY - Solutions that Target Key Areas of Pain

E N D
Optimizing Your Revenue Cycle Operations - a guide to superior performance Presented by: Derek Morkel, CEO HealthTechS3, GAFFEY Healthcare, LLC
About HealthTechs3 Strategy – Solutions – Support 2
GAFFEY - Solutions that Target Key Areas of Pain • Revenue Recovery * Automation & Efficiency * Collection Services Increase Cash 20-30% decrease 1-4% increase Increase in Clean & Complete Claims Claims Management Poor Workflow & Task Efficiency AlphaCollector Lack of Collection Automation AutoStatus Denial Identification & Management Remittance360 Under Payment & Revenue Integrity Contract Calculator Correct Patient Information Integrated Eligibility
OBJECTIVES Objectives: Doing the Basics Right --------------------------------------------------------------------------- • Revenue Cycle Optimization – what are we focused on every day and why? • Learn which factors drive Revenue Cycle performance • Where are we losing $ - missing opportunities • Understand how technology can enable better results • What should we be measuring & how often • List of KPI’s and Benchmarks to use in your facility
The 4 R’s – getting the right building blocks in place --------------------------------------------------------------------------- • People + Process + Technology = Results Right Team Focused on the Right Process Enabled by the Right Technology The right team is the critical building block Drives the Right Results
Measurement is the core of any process --------------------------------------------------------------------------- • "An acre of performance is worth a whole world of promise." • - William Dean Howells • "Don't rate potential over performance." • - Jim Fassel • "Goal setting has traditionally been based on past performance. This practice has tended to perpetuate the sins of the past." • - Joseph M. Juran • "If you can't describe what you are doing as a process, you don't know what you are doing.” • - W. Edwards Deming • "In God we trust, all others bring data." • - W. Edwards Deming
Measurement is the core of any process --------------------------------------------------------------------------- • ”Trust but verify” • - Ronald Reagan
What is the strategic imperative? --------------------------------------------------------------------------- “CASH IS KING” Cash Collections Cost to Collect
What is the strategic imperative? --------------------------------------------------------------------------- • Net Revenue is the largest line item on a hospital’s Income Statement • where do your managers spend the majority of their time? • Accounts Receivable typically the largest liquid asset on the Balance Sheet • Thin operating margins put pressure on cash management
What is the strategic imperative? --------------------------------------------------------------------------- • 1-5% of Net Revenue is lost in the typical US Hospital due to Revenue Cycle inefficiency
Overriding Revenue Cycle Principles: --------------------------------------------------------------------------- • All of the daily activities should answer one of 2 questions: • Does it increase cash collections? • Is it improving a process?
Focus Areas – Back to Basics: --------------------------------------------------------------------------- • Always start at the beginning!! • Clean & Complete Claims • Bill Accounts Timely - DNFB • Collector Productivity & Automation • Technology to ensure accuracy & efficiency • Efficient Coordination other Depts. – CM/UR • CFO/Administration engagement • NEW – Have a plan for Value Based Care
VBC – not if but when – Have a Plan --------------------------------------------------------------------------- • 923 ACO’s – 32 million lives – 10% US Population • Data from Leavitt Partners report – Growth & Dispersion of Accountable Care Organizations. www.leavittpartners.com
VBC – not if but when – Have a Plan ---------------------------------------------------------------------------
VBC – Mission Critical Software Components --------------------------------------------------------------------------- • CURRENT TOOLS – Will be basis for future state • Enterprise Data Warehouse – have to be able to aggregate data from different platforms • Cost Accounting – have to know what costs are by patient across enterprise – not just for hospital • Risk/Probability Modelling – have to know patients at risk • Bundled Payment Calculation Tool • Population Management – ability to drive lower cost outcomes • Verification – ability to verify calculations for Risk Sharing models
Focus Areas – Back to Basics: --------------------------------------------------------------------------- • Time allocation • Decide daily/weekly priority • Allocate time accordingly • Stick to plan
Back to Basics: Clean & Complete Claims --------------------------------------------------------------------------- • Getting it correct on the front end • 70% of the data required for billing comes from registration • Registration accuracy related to this data is ~ 50% • 50% of the denials can be traced back to admission based errors • A typical rebill costs $25-$35 per claim
Back to Basics: Clean & Complete Claims: --------------------------------------------------------------------------- • A clean claim is not necessarily complete!! • All the data elements are complete and correct • DOS, SSN, Name, Qty, Amounts • Necessary charge components are all present • E.g. all implants are charged and coded correctly (claim can be clean without – but not complete) • Coding is appropriate for the level of service provided
Back to Basics: Bill Accounts Timely --------------------------------------------------------------------------- • Billing efficiency starts with clean & complete claims • Electronic bill as many payors as possible • Unbilled worked daily • Failed claims worked daily • Errors/Inefficiencies shared with admitting & preregistration [Admitting QA] • Utilize all billing software auto-bill & edit capabilities
Back to Basics: Collector Productivity --------------------------------------------------------------------------- • Productivity is directly tied to billing clean claim % • Measure daily • Match payors (difficulty) to collector ability • Issues shared with billing & admitting • Defined strategy for denials & difficult to collect AR (Workers Compensation) • Review account notes
Top 10 – Lost Revenue $ - the easy money!! ------------------------------------------------------------------------
Collections Strategy: Non Self Pay [includes Medicare, Medicaid, Managed Care] ---------------------------------------------------------------------------
Collections Strategy: Self Pay ---------------------------------------------------------------------------
Why is technology important? --------------------------------------------------------------------------- • The right technology can provide more standardized information and automate certain processes that are subject to human variability • Consider ED Claims Analysis • Complexity and number of patients makes this too expensive for FTE to monitor for all claims • Claim data allows for use of algorithms to pinpoint areas of opportunity
Top 10 – Required elements of a RC program ------------------------------------------------------------------------
Technology – What are key components?: ---------------------------------------------------------------------------
Establishing a culture of measurement --------------------------------------------------------------------------- • What should we be measuring and how often? • Drivers – Leading • Intense focus on these drives overall performance • Intermediate – Monitoring • Areas of performance that require periodic attention • Result Oriented • Result of previous 2 – focus will not provide change
What are KPI’s? --------------------------------------------------------------------------- • KPI = “Key Performance Indicator” “Key Performance Indicators are quantifiable measurements, agreed to beforehand, that reflect the critical success factors of an organization or process.” KPI’s are the measurement tools of the philosophy that if you don’t measure something you have no way to know if you are improving. A focus on the underlying metrics (KPI’s) of AR management is the core of a successful organization. “How can I fix it if I don’t know its broken?”
KPI’s – Example hierarchy --------------------------------------------------------------------------- • Drivers – Leading • Cash • DNFB • Failed Claims • Late Charges • Intermediate – Monitoring • Cash by functional area • AR Aging • Result Oriented • AR Days
KPI’s – Daily Cash Sheet Items--------------------------------------------------------------------------------------- Daily Performance - Macro • Cash • vs. Budget • AR Aging > 60 days • Inpatient & Outpatient • vs. Budget, Prior Year & Prior Month • Gross Revenue • Late Charges (Note: seldom focused on but critical process issue)
KPI’s – Late Charges --------------------------------------------------------------------------------------- Late Charges – process killer • % charge contracts – every $ missed revenue • Daily Departmental Charge Reconciliation • Chargeable supplies • are you charging all items • consider bar coding potential • Create significant process issues with claims
KPI’s – Daily Cash Sheet Items--------------------------------------------------------------------------------------- Daily Performance - Micro • Discharged Not Final Billed (DNFB) > 4 days – Patient Accounting • Patient Accounting • Medical Records/HIM • DNFB – Failed Claims in Billing Software • POS Cash • Registration Accuracy
KPI’s – Other potential items to measure--------------------------------------------------------------------------------------- Weekly KPI’s • Cash by functional category – Insurance, POS, Agency • DNFB – Business Office & Medical Records • DNFB – Failed Claims in Billing Software • AR Aging > 60 days by Financial Class • AR Aging > 180 days • Denials
KPI’s – Other potential items to measure--------------------------------------------------------------------------------------- Monthly KPI’s • Cash as % Net Patient Revenue • excluding effect of amounts “due to/due from” State, Federal sources • AR Days • by facility • by Payor • AR Aging by Financial Class • Collection Agency Performance • Registration Accuracy
AR & KPI’s – Keys to Success --------------------------------------------------------------------------- • Consistency • Decide what you are going to measure & keep measuring it • Follow up daily, weekly on key items • Accountability • There has to be consequences for both success & failure • Keep evaluating the process – feedback is critical • Change is constant – your KPI’s may change
KPI’s – Daily Roadmap--------------------------------------------------------------------------- 36
KPI’s – Weekly Roadmap --------------------------------------------------------------------------- 37
KPI’s – Monthly Summary --------------------------------------------------------------------------- 38
KPI’s – Monthly Summary Cont’d--------------------------------------------------------------------------- 39
Top 10 – Lost Revenue $ - the easy money!! ------------------------------------------------------------------------ 40
GAFFEY - Solutions that Target Key Areas of Pain • Revenue Recovery * Automation & Efficiency * Collection Services Increase Cash 20-30% decrease 1-4% increase Increase in Clean & Complete Claims Claims Management Poor Workflow & Task Efficiency AlphaCollector Lack of Collection Automation AutoStatus Integrated Reporting & Process Insight AlphaAnalytics Under Payment & Revenue Integrity Contract Calculator Correct Patient Information Integrated Eligibility
Superior Revenue Cycle Performance --------------------------------------------------------------------------- Questions?