Download
1 / 23
260 likes | 2.04k Views
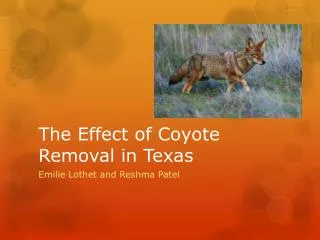
The Effects of Coyote Removal in Texas: A Case Study in Conservation Biology . Adapted from activity by Margaret Carroll Department of Biology Framingham State College . National Center for Case Study Teaching in Science website; http://ublib.buffalo.edu/libraries/projects/cases/case.html .

E N D
The Effects of Coyote Removal in Texas:A Case Study in Conservation Biology Adapted from activity byMargaret CarrollDepartment of BiologyFramingham State College National Center for Case Study Teaching in Science website; http://ublib.buffalo.edu/libraries/projects/cases/case.html
Plains of West Texas • Shortgrass prairie • chaparral
Primary Producers: • Grasses, herbaceous flowering plants (forbs) • Mesquite, yucca
Herbivores & Scavengers • Jackrabbits & cottontails • Ground squirrels • Rats (3 species) • Mice (7 species) Ord’s Kangaroo Rat
Mesopredators • Badgers • Bobcats • Skunks • Grey fox
Top Predator • Coyote
What does this food web look like? • Ideas – • Draw on board
Part I • Predator removal • The Nature Conservancy wants to determine the effects of coyote removal in West Texas • Your group has been asked to submit a proposal
Part I Questions • What specific question do you intend to answer? • What type of experimental treatment and control will you use? • What variables do you intend to monitor?
Part II • Congratulations! Your proposal has been funded. • Experimental design: • Four, 5,000 ha sites • 2 controls, 2 treatments • Similar ecological communities represented
Part II – Experimental Design Figure 1. Location of experimental sites in West Texas. Sites 1 and 2 were the control sites. Coyotes were removed from sites 3 and 4 and from a 5-km border (figure from Henke and Bryant 1999, used with permission).
Part II-Experimental Design • Experimental design: • Four, 5,000 ha sites • 2 controls, 2 treatments • All coyotes removed from treatment sites & 5 km border • No manipulation of control sites • Animal community monitored on all sites: • 1 year prior to treatment • 2 years following coyote removal
Part II Question • Make two predictions concerning the effects of coyote removal on the fauna of West Texas.
Part III - Mesopredators • Mesopredator populations monitored for 3 years • Total abundance of badgers, bobcats, skunk and fox found on treatment and control sites plotted each year • Use these data to interpret the impact of coyote removal on the community of small mammalian predators
Part III - Mesopredators Figure 2. Relative abundance of mammalian mesopredators in the experimental sites before and after treatment. Error Bars represent one standard error (figure modified from Henke and Bryant 1999, used with permission).
Part III - Mesopredators Questions • What effect does coyote removal have on the mesopredator populations? • Predict what might have happened to the rodent populations as a result of changes in the mesopredator populations.
Part IV – Rodent Population Size • You decide to analyze data on rodent population size next • As a measure of population size, you compare rodent biomass in grams per hectare in treatment vs. control areas over 3 years
Part IV – Rodent Population Size Figure 3. Biomass of rodents in the experimental sites before and after coyotes were removed from the treatment sites. Error Bars represent one standard error (figure modified from Henke and Bryant 1999, used with permission).
Part IV – Rodent Population Size • Questions • What do you think is the primary factor controlling rodent population growth? • Given the changes in population size, what other changes might you expect in the rodent community?
Part V – Rodent Diversity • Population size of individual rodent species shows Ord’s kangaroo rat doing very well in treatment areas • Examine the data:
Part V – Rodent Diversity Figure 4. Diversity of rodents in the experimental sites before and after coyotes were removed from the treatment sites. Rodent diversity was estimated using Simpson's Index. Error Bars represent one standard error (figure modified from Henke and Bryant 1999, used with permission).
Part V – Rodent Diversity Questions • In one sentence summarize the meaning of the graph shown in Figure 4. • How does the competitive success of Ord's kangaroo rat change in the absence of coyotes? • What term could be used to describe the role of the coyote in this community? • Propose one possible cause for the decline in rodent diversity in the control areas after treatment begins. • In your report to The Nature Conservancy, how will you summarize the impact of coyote removal in this community?
References • Henke, S.E., and F.C. Bryant. 1999. Effects of coyote removal on the faunal community in Western Texas. Journal of Wildlife Management 63:1066-1081. • Carroll, M. 2002. The effects of coyote removal in Texas: A case study in conservation biology. National Center for Case Study Teaching in Science website: http://ublib.buffalo.edu/libraries/projects/cases/case.html ; site visited 9/06