Download

1 / 13
130 likes | 254 Views
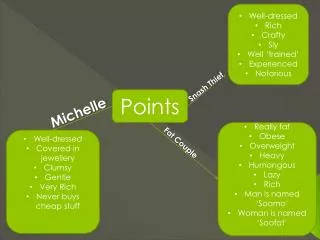
Cutoff Points. Aligning District Assessments to STAR CST Bands. ACSA Conference November 2, 2006 San Diego. Patrick Traynor, Ph.D., Director of Assessment and Evaluation Colton Joint Unified School District www.PatrickTraynor.com Patrick_Traynor@colton.k12.ca.us.

E N D
Cutoff Points Aligning District Assessments to STAR CST Bands ACSA Conference November 2, 2006 San Diego Patrick Traynor, Ph.D., Director of Assessment and Evaluation Colton Joint Unified School District www.PatrickTraynor.com Patrick_Traynor@colton.k12.ca.us
Distribution of 2004-05 Seventh Grade Students (%) In 2004-05 Semester 1 Bands According to 2004-05 ELA CST Band Using Original Cutoffs
Distribution of 2004-05 Seventh Grade Students (#) In 2004-05 Semester 1 Bands According to 2004-05 ELA CST Band Using Current Cutoffs
Percentage of Kids in Each ELA CST Band Who Received Each Semester Exam Raw Score
From Raw Score ELA Semester 1 Grade 7 ELA CST Band N Mean Std. Dev. 5 (Advanced) 89 58.16 3.067 4 (Proficient) 417 52.84 4.301 3 (Basic) 636 44.17 6.792 2 (Below Basic) 400 35.24 7.801 1 (Far Below Basic) 153 28.69 8.930
% Distribution with Means of Students within Each ELA CST Band 28.69 35.24 44.18 52.84 58.16
The Four Cut Points on Each Exam Should • Separate the students into five corresponding bands • Optimize % of students who scored in a particular ELA band within their corresponding semester exam band • For example, . . .
% Distribution with Means of Students within Each ELA CST Band 1 2 3 4 5 Cut point maximizes % of ELA CST Advanced Proficient Kids who receive a placement level of 5 of the End of Semester Exam and . . . % ELA CST Proficient Kids who receive a 4 on the End of Semester Exam 28.69 35.24 44.18 52.84 58.16
Distribution of 2004-05 Seventh Grade Students (%) In 2004-05 Semester 1 Bands According to 2004-05 ELA CST Band Using Aligned Cutoffs
Distribution of 2004-05 Second Grade Students (#) In 2004-05 Semester 1 Bands According to 2004-05 ELA CST Band Using Aligned Cutoffs