Download
1 / 1
10 likes | 76 Views
Atmospheric Ca 2+ Deposition Within the United States and Implications for Soil Inorganic Carbon Sequestration Megan A. Goddard 1 , Elena A. Mikhailova 2 , Christopher J. Post 2 , Mark A. Schlautman 3 and John M. Galbraith 4

E N D
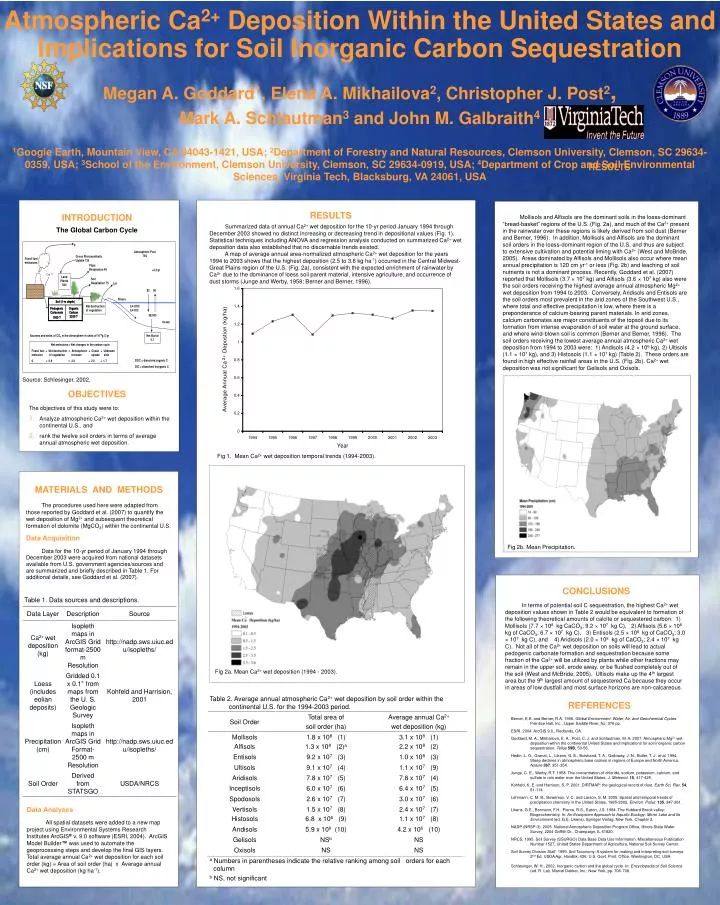
Atmospheric Ca2+Deposition Within the United States and Implications for Soil Inorganic Carbon Sequestration Megan A. Goddard1, Elena A. Mikhailova2, Christopher J. Post2, Mark A. Schlautman3 and John M. Galbraith4 1Google Earth, Mountain View, CA 94043-1421, USA; 2Department of Forestry and Natural Resources, Clemson University, Clemson, SC 29634-0359, USA; 3School of the Environment, Clemson University, Clemson, SC 29634-0919, USA; 4Department of Crop and Soil Environmental Sciences, Virginia Tech, Blacksburg, VA 24061, USA Ca 2+ RESULTS RESULTS • INTRODUCTION • The Global Carbon Cycle • Source: Schlesinger, 2002. • OBJECTIVES • The objectives of this study were to: • Analyze atmospheric Ca2+ wet deposition within the continental U.S., and • rank the twelve soil orders in terms of average annual atmospheric wet deposition. Mollisols and Alfisols are the dominant soils in the loess-dominant “bread-basket” regions of the U.S. (Fig. 2a), and much of the Ca2+ present in the rainwater over these regions is likely derived from soil dust (Berner and Berner, 1996). In addition, Mollisols and Alfisols are the dominant soil orders in the loess-dominant region of the U.S. and thus are subject to extensive cultivation and potential liming with Ca2+ (West and McBride, 2005). Areas dominated by Alfisols and Mollisols also occur where mean annual precipitation is 120 cm yr-1 or less (Fig. 2b) and leaching of soil nutrients is not a dominant process. Recently, Goddard et al. (2007) reported that Mollisols (3.7 × 10⁷ kg) and Alfisols (3.6 × 10⁷ kg) also were the soil orders receiving the highest average annual atmospheric Mg2+ wet deposition from 1994 to 2003. Conversely, Aridisols and Entisols are the soil orders most prevalent in the arid zones of the Southwest U.S., where total and effective precipitation is low, where there is a preponderance of calcium-bearing parent materials. In arid zones, calcium carbonates are major constituents of the topsoil due to its formation from intense evaporation of soil water at the ground surface, and where wind-blown soil is common (Berner and Berner, 1996). The soil orders receiving the lowest average annual atmospheric Ca2+ wet deposition from 1994 to 2003 were: 1) Andisols (4.2 × 10⁶ kg), 2) Ultisols (1.1 × 10⁷ kg), and 3) Histosols (1.1 × 10⁷ kg) (Table 2). These orders are found in high effective rainfall areas in the U.S. (Fig. 2b). Ca2+ wet deposition was not significant for Gelisols and Oxisols. Summarized data of annual Ca2+ wet deposition for the 10-yr period January 1994 through December 2003 showed no distinct increasing or decreasing trend in depositional values (Fig. 1). Statistical techniques including ANOVA and regression analysis conducted on summarized Ca2+ wet deposition data also established that no discernable trends existed. A map of average annual area-normalized atmospheric Ca2+ wet deposition for the years 1994 to 2003 shows that the highest deposition (2.5 to 3.6 kg ha-1) occurred in the Central Midwest-Great Plains region of the U.S. (Fig. 2a), consistent with the expected enrichment of rainwater by Ca2+ due to the dominance of loess soil parent material, intensive agriculture, and occurrence of dust storms (Junge and Werby, 1958; Berner and Berner, 1996). Fig 1. Mean Ca2+ wet deposition temporal trends (1994-2003). MATERIALS AND METHODS The procedures used here were adapted from those reported by Goddard et al. (2007) to quantify the wet deposition of Mg2+ and subsequent theoretical formation of dolomite (MgCO3) within the continental U.S. Data Acquisition Data for the 10-yr period of January 1994 through December 2003 were acquired from national datasets available from U.S. government agencies/sources and are summarized and briefly described in Table 1. For additional details, see Goddard et al. (2007). Fig 2b. Mean Precipitation. CONCLUSIONS In terms of potential soil C sequestration, the highest Ca2+ wet deposition values shown in Table 2 would be equivalent to formation of the following theoretical amounts of calcite or sequestered carbon: 1) Mollisols (7.7 × 10⁸ kg CaCO3; 9.2 × 10⁷ kg C), 2) Alfisols (5.6 × 10⁸ kg of CaCO3; 6.7 × 10⁷ kg C), 3) Entisols (2.5 × 10⁸ kg of CaCO3; 3.0 × 10⁷ kg C), and 4) Aridisols (2.0 × 10⁸ kg of CaCO3; 2.4 × 10⁷ kg C). Not all of the Ca2+ wet deposition on soils will lead to actual pedogenic carbonate formation and sequestration because some fraction of the Ca2+ will be utilized by plants while other fractions may remain in the upper soil, erode away, or be flushed completely out of the soil (West and McBride, 2005). Ultisols make up the 4th largest area but the 9th largest amount of sequestered Ca because they occur in areas of low dustfall and most surface horizons are non-calcareous. Fig 2a. Mean Ca2+ wet deposition (1994 - 2003). REFERENCES Berner, E.K. and Berner, R.A. 1996. Global Environment: Water, Air, and Geochemical Cycles. Prentice Hall, Inc., Upper Saddle River, NJ, 376 pp. ESRI. 2004. ArcGIS 9.0., Redlands, CA. Goddard, M. A., Mikhailova, E. A., Post, C. J. and Schlautman, M. A. 2007. Atmospheric Mg2+ wet deposition within the continental United States and implications for soil inorganic carbon sequestration. Tellus59B, 50-56. Hedin, L. O., Granat, L., Likens, G. E., Buishand, T. A., Galloway, J. N., Butler, T. J. et al. 1994. Steep declines in atmospheric base cations in regions of Europe and North America. Nature367, 351-354. Junge, C. E., Werby, R.T. 1958. The concentration of chloride, sodium, potassium, calcium, and sulfate in rain water over the United States. J. Meteorol. 15, 417-425. Kohfeld, K. E. and Harrison, S. P. 2001. DIRTMAP: the geological record of dust. Earth Sci. Rev.54, 81-114. Lehmann, C. M. B., Bowersox, V. C. and Larson, S. M. 2005. Spatial and temporal trends of precipitation chemistry in the United States, 1985-2002. Environ. Pollut.135, 347-361. Likens, G.E., Bormann, F.H., Pierce, R.S., Eaton, J.S. 1984. The Hubbard Brook valley: Biogeochemistry. In: An Ecosystem Approach to Aquatic Ecology: Mirror Lake and Its Environment (ed. G.E. Likens). Springer Verlag, New York. Chapter 2. NADP (NRSP-3). 2005. National Atmospheric Deposition Program Office, Illinois State Water Survey, 2204 Griffith Dr., Champaign, IL 61820. NRCS. 1995. Soil Survey (SSURGO) Data Base Data Use Information. Miscellaneous Publication Number 1527, United States Department of Agriculture, National Soil Survey Center. Soil Survey Division Staff. 1999. Soil Taxonomy: A system for making and interpreting soil surveys. 2nd Ed. USDA Agr. Handbk. 436. U.S. Govt. Print. Office, Washington, DC, USA. Schlesinger, W. H., 2002. Inorganic carbon and the global cycle. In: Encyclopedia of Soil Science (ed. R. Lal). Marcel Dekker, Inc., New York, pp. 706-708. Data Analyses All spatial datasets were added to a new map project using Environmental Systems Research Institutes ArcGIS® v. 9.0 software (ESRI, 2004). ArcGIS Model Builder™ was used to automate the geoprocessing steps and develop the final GIS layers. Total average annual Ca2+ wet deposition for each soil order (kg) = Area of soil order (ha) x Average annual Ca2+ wet deposition (kg ha-1).