Download
1 / 53
530 likes | 710 Views
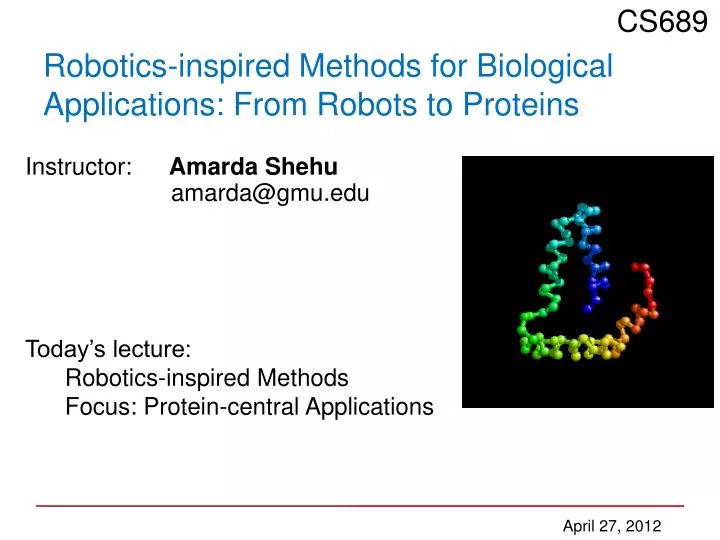
CS689. Robotics-inspired Methods for Biological Applications: From Robots to Proteins. Instructor: Amarda Shehu amarda@gmu.edu. Today’s lecture: Robotics-inspired Methods Focus: Protein-central Applications. April 27, 2012. Analogies Employed by Robotics Researchers.

E N D
CS689 Robotics-inspired Methods for Biological Applications: From Robots to Proteins Instructor: AmardaShehu amarda@gmu.edu Today’s lecture: Robotics-inspired Methods Focus: Protein-central Applications April 27, 2012
Analogies Employed by Robotics Researchers • Protein molecule spheres - atoms cylinders – bonds connecting spheres • Protein conformation spatial arrangement of atoms • Transition between conformations rotation of bonds • A protein chain connects atoms with bonds • Analogy between proteins and kinematic chains with revolute joints: • Bonds can be treated as links • Atoms can be treated as joints • Rotation of bonds can be modeled as rotation of joints • Rotations give rise to protein conformations • Conformation is the equivalent of a configuration
Problems of Interest to Robotics Researchers • A protein transitions between conformations until it finds a lowest-energy conformation where it is biologically active • Such a conformation is guaranteed to exist from the theory of equilibrium thermodynamics • The native conformation is also referred to as the folded conformation • Interesting problems on proteins: • Structure Prediction: Given the sequence of the atoms that make up a protein molecule, determine the native conformation • Folding: Given the folded conformation, find the paths that the protein follows to fold onto this conformation • Docking: Given a folded protein conformation and a small drug molecule, find how and where the drug docks onto the molecule
Molecular Motion is Essential for Life Drug molecules act bybinding to proteins Sometimes protein is too flexible and does not bind to drug Mad cow disease is caused by misfolding
Configuration Space and Conformational Space A B continuous energy field 0/1 obstacles articulated robot protein chain • Protein conformational space articulated robot configuration space of higher dimensionality • Similar sampling techniques dofs - torsional angles • 0/1 collisions energy surface instead atoms interact with one another giving rise to potential energy Hundreds to thousands of revolute dofs in real protein chains
Robotics-inspired Methods to Study Proteins • Problem often explored in robotics community: Given two protein conformations A and B, plan motions from A to B • When B is the experimentally-available native/folded structure, sequence of computed motions offers likely “folding” pathways • Sampling-based motion planning methods for proteins • Amato N. M., Dill A., and Song G. J. Comp. Biol. 10, 2002 • Kim K. M., Jernigan R. L., and Chirikjian G. S. Biophys. J. 83, 2002 • Apayadin M. S. et al. J. Comp. Biol. 10, 2003 • Cortes J. et al. Bioinformatics 21, 2005 • Lee A., Streinu I., and Brock O. J. Phys. Biol. 2, 2005 • Georgiev I. and Donald, R. B. Bioinformatics 23, 2007 • Folding problem is often targeted due to its analogies with finding paths to connect a start and goal configuration in a roadmap • Structure prediction problem, where the native conformation is not known and needs to be computed, is considered more challenging
1. Exploration of a High-dimensional Space backbone of N amino acids 2N dofs Energy surface associated with conformational space [Onuchic J.N., Luthey-Schulten Z., and Wolynes P.G. Annu. Rev. Phys. Chem. 48, 1997] Potential Energy Evolution has “guided” native state (in naturally-occurring proteins) to be lowest free-energy state [Unger R. and Moult, J. Bull. Math. Biol. 55, 1993] K. Dill lab Energy surface is rugged and constellated with local minima [Onuchic J.N., Luthey-Schulten Z., and Wolynes P.G. Annu. Rev. Phys. Chem. 48, 1997] Conformational Coordinates In structure prediction: Explore a high-dimensional space in search of native-like (low-energy) conformations
2. Representation (Modeling Problem) • Discrete: atoms in a lattice • Continuous: off-lattice models Coarse-grained to fine-grained lbl.gov Needed: diverse coarse-grained conformations near the native state that can be further refined in all-atom detail Courtesy of C. Clementi State-of-the-art approach: compute at coarse-grained detail, refine at higher resolution later
3. Vast Space, Approximate Energy Function bond stretch torsional valence angle bend nonbonded dihedrals K(1 + cos(n - )) bonds Kb(b – b0)2 Inherent errors or biases in energy functions warrant focus on diverse emerging minima relevant for the native state nonbonded [(Rminij/rij)12 – (Rminij/rij)6] • Empirical force-fields to measure potential energy:AMBER ff*, CHARMM, OPLS, AMW, Rosetta, … angle K( - 0)2
Exploration of Conformational Space K. Dill lab • Traditional Approaches - Monte Carlo (MC) • trajectory-based exploration • initial conformations, length of trajectories, • number of trajectories are important decisions • Strategies to enhance MC sampling : • simulated annealing, umbrella sampling, replica exchange, local elevation, activation relaxation, local energy flattening, jump walking, conformational flooding, Markov state modeling, discrete timestep MD, and more [cf. to van Gunsteren et al. Angew. Chem. Int. Ed. Engl. 45, 2006] • State-of-the-art on enhancing sampling of native-like conformations: • fragment-based assembly on simpler coarse-grained conformational space Challenge: ensuring computed conformations are geometrically-distinct and not representative of only a few regions of conformational space
A. Shehu, An Ab-initio Tree-based Exploration to Enhance Sampling of Low-energy Protein Conformations, Robotics: Science & Systems, 2009, pg. 31-39. • Proposed method: Fragment Monte CarLoTree Exploration (FeLTr) • Goal : rapidly compute diverse native-like conformations • applicability: conformations can serve as good starting points for larger detailed studies of protein engineering and design • Novelty: tree-based exploration guided with projection layers
Tree-based Exploration in FeLTr • Tree –based search • (i) select vertex for expansion • (ii) expand vertex • (i) reconciles • towards lower energies • towards diverse conformations • (ii) – Metropolis Monte Carlo trajectory • employs fragment-based assembly • move = fragment configuration found in native conformations Tree naturally integrates decisions about number of trajectories and selection of conformations in a trajectory from where to continue the exploration
Expansion Step in FeLTr: Monte Carlo Trajectory Assemble conformations with physical configurations of protein fragments • Fragment = k consecutive amino acids • Configurations of this fragment: 6 backbone dihedral angles • Sample configurations from those found in native protein structures for a fragment of that specific amino-acid sequence Monte Carlo move in FeLTr: propose configuration of k = 3 three consecutive amino-acids in conf C i i+2 aaa Metropolis criterion: change in energy evaluated after an attempted move, accepted with probability e-E/RT Expanding C through N-2 moves results in Cnew 1 Database of trimer configurations built from non-redundant PDB 203
Expansion Step: Representation and Energy Function • CB representation: explicit backbone and CB atoms • Energy evaluated with coarse energy function based on AMW of Papoian et al. PNAS 101, 2004 R* = RgPDB • Additional energy term to obtain compact conformations • Purpose: native-like conformations are compact • Penalizes conformation if radius of gyration Rg (root-mean-square distance of atoms from c.o.m.) > R* value • R* value calculated from what is expected for a chain of same number of amino acids in the PDB • RgPDB = 2.83 * N0.34
Selection Step in FeLTr: Two Projection Layers Select for expansion low-energy conformations that fall in under-explored regions of the conformational space • Tree mapped on: • (i) 1d energy grid • (ii) 3d grid – projection of conformational space • Grids used to bias selection for expansion to: • conformations that have low energies and • map to scarce cells of projection space
Geometric Projection of Conformational Space Finding a few conformational coordinates (reaction coordinates) to effectively represent and compare conformations is an open research area • Ultrafast shape recognition (USR) features proposed to encapsulate overall shape [Ballester, Richards, J. Comput. Chem. 2007] • Features are momenta of atomic distance distributions from four reference points: • centroid (ctd) • closest to centroid (cst) • farthest from cst (fct) • farthest from fct (ftf) conformation • Reference points capture well-separated extremes in a conformation • Atomic distances from each reference point yield non-redundant information reference point
Illustrating Interplay of Projection Layers in FeLTr To select vertex for expansion 1. select energy level l 2. select projection cell c 1. Select energy level l w(l)= Eavg(l) * Eavg(l) + p(l) = w(l) / [l’ w(l’) ] 2. Select projection cell c w(c)= 1.0 / [ (1 + nsel(c) ) * nconfs(c) ] p(c) = w(c) / [c’ w(c’) ] Details: = 1.0/222 nsel(c) = nr. times c selected nconfs(c) = nr. confs in c
Chosen Test Proteins and Simulation Settings Tryptophan cage, Pin1 Trp-Trp ww domain, villin headpiece, engrailed homeo-domain, bacterial ribosomal protein, immunoglobulin binding domain of streptococcal protein G, calbindin D9k • Implementation & system details: • 3d grid: 30x30x30 • 1d grid cell size: 2 kcal/mol • C++, Intel Core2 Duo, • 4GB RAM, 2.66 GHZ CPU • Simulation settings: • capture native state in limited simulation time: <= 3 CPU hours • fit exploration tree and ensemble in memory: <= 50,000 conformations • Analysis of applications on the seven chosen test sequences focuses on: • is experimentally-available native structure reproduced? • what is the diversity of ensemble of lowest-energy conformations? • compare with a Monte Carlo simulation of same fragment assembly, energy function, time and ensemble size
Able to Capture Diverse Minima in Limited Time wwD hp36 eHD Calbindin D9k • Analysis shows better use of time and population of more energy minima than an MC simulation • Some native topologies difficult to capture with current energy function GB1
Focus on Folding Given the folded conformation, compute folding pathways that the protein potentially follows to fold onto the biologically-active/native conformation soon after it is synthesized in the ribosome
Roadmap-Based Representation • Compact representation of many motion pathways • Coarse resolution relative to MC simulations • Efficient algorithms for analyzing multiple pathways
Roadmaps on Protein FoldingN.M. Amato, K.A. Dill, and G. Song. Using Motion Planning to Map Protein Folding Landscapes and Analyze Folding Kinetics of Known Native Structures. J. Comp. Biology, 10(2):239-255, 2003 • Known native conformation of a protein chain • Degrees of freedom: φ-ψ angles • Energy: van der Waals, hydrogen bonds, hydrophobic effect • New idea:Novel sampling to generate conformations • Application: Finding order of formation of certain secondary structures that can be validated with experimental data
Sampling Strategy (Node Generation) • High dimensionality non-uniform sampling • Conformations generated by sampling angle values from Gaussian distributions around angles of reference conformations • Two-tier sampling employed to obtain good coverage of conformational space fast
Sampling Strategy (Node Generation) • Tier 1: Gaussian distribution around native state • Conformations are sorted into bins by number of native contacts (pairs of neighboring C atoms in native conformation) • Tier 2: Conformations from low-filled bins picked to be perturbed • Gaussian distributions with increasing standard deviations
P = if Emin E Emax Sampling Strategy (Node Generation) • A generated conformation is added to the roadmap with probability P: • Values of Emin and Emax chosen to obtain conformations with few collisions (well-separated side-chain spheres) 0 if E > Emax Emax-E Emax-Emin 1 if E < Emin
Sampling Strategy (Edge Generation) • Simple straight-line planner is employed to connect two neighboring conformations A and B • Euclidean distance used to measure distance(A, B) • A fixed number of intermediate conformations in a straight line checked for energetic feasibility • All intermediates have to be feasible to connect A and B with an edge • Sum of negative logs used to associate a weight with the edge
Application: Order of Formation of Secondary Structure Elements (SSE) • The lowest-weight path is extracted from each denatured conformation to the folded one • The order of formation of SSE’s is computed along each path • The formation order that appears the most often over all paths is considered the SSE formation order of the protein
Statistics on the Roadmap • A summary contact matrix is constructed, which records the time step when each native contact appears • The time step at which a secondary structure element appears is approximated as the average of the appearance time steps of the contacts that participate in the structure
a forms at time step 122 (II) b3 and b4 come together at 187 (V) b2 and b3 come together at 210 (IV) b1 and b4 come together at 214 (I) a and b4 come together at 214 (III) Protein CI2 (1a + 4 b)
SSE’s roadmap size 1a+4b 5126, 70k 5471, 104k 3a 7975, 104k 1a+4b 8357, 119k 1a+5b CI2 Comparison with Experimental Data Contact formation orders from hydrogen-exchange experiments used for validation
Focus on Mini-version of Structure Prediction Goal: analyze flexibility of specific fragments in protein chains fragment of interest shown in blue Why: fragment may impact interaction of protein with a drug molecule
Conformational Analysis of Protein LoopsJ. Cortés, T. Siméon, M. Renaud-Siméon, and V. Tran. Geometric Algorithms for the Conformational Analysis of Long Protein Loops. J. Comp. Chemistry, 25:956-967, 2004 New idea: Explore the clash-free subset of the conformational space of a loop through an RRT-based method Kinematic model: f-yangles on the backbone + citorsional angles in side chains
Application of Random Loop Generator (RLG) • Amylosucrase (AS) • - Only enzyme in its family that acts on sucrose substrate • The 17-residue loop (named loop 7) between Gly433 and Gly449 is • believed to play a pivotal role
RRT Construction in RLG • Extending RRT rooted at a start conformation qstart: • A loop conformation qrand is generated at random • Need satisfy neither closure nor clash-free check • Node qnear nearest to qrandin current RRT is selected • qnear satisfies both closure and clash-free check • New nodes qfeas are obtained by iteratively pulling qneartowards qrand • A new node qnew that is an intermediate between qnearand qrand is added to the RRT
qrand RRT Construction in RLG C Cfree Cclosed qnear qstart
qrand RRT Construction in RLG C Cfree Cclosed qstart Stops when one can’t get closer to qrandor a clash is detected
Computational Results • Surprisingly, loop 7 can’t move much • Main bottleneck is residue Asp231 Positions of theCa atom of middleresidue (Ser441)
Computational Results • Surprisingly, loop 7 can’t move much • Main bottleneck is residue Asp231
Computational Results • If residue Asp231 is “removed”, then loop 7’s mobility increases dramatically. The Caatom of Ser441 can be displaced by more than 9Å from its crystallographic position
Focus on Docking: Find protein-ligand conformations with lowest interaction energy
A.P. Singh, J.C. Latombe, and D.L. Brutlag. A Motion Planning Approach to Flexible Ligand Binding. Proc. 7th ISMB, pp. 252-261, 1999 • Study of ligand-protein binding • Ligandis a small flexible molecule, but protein is assumed rigid • Problem is to find configurations of the ligand near the protein’s unknown active site that result in low-energy protein-ligand pairs • PRM-based method • Goal protein-ligand state is not known • Goal states need to be sampled as well
A.P. Singh, J.C. Latombe, and D.L. Brutlag. A Motion Planning Approach to Flexible Ligand Binding. Proc. 7th ISMB, pp. 252-261, 1999 • A fixed coordinate system P is attached to the protein. • A moving coordinate system L is attached to the ligand. L is defined using three bonded atoms in the ligand • A conformation of the ligand is defined by the position and orientation of L relative to P and the torsionalangles of the ligand
Roadmap Construction (Node Generation) • The nodes of the roadmap are generated by sampling conformations of the ligand uniformly at random in the parameter space (around the protein) • The energy E at each sampled conformation is computed: E = Einteraction + Einternal Einteraction = electrostatic + van der Waals potential Einternal = Snon-bonded pairs of atoms electrostatic + van der Waals
P = if Emin E Emax Roadmap Construction (Node Generation) • The nodes of the roadmap are generated by sampling conformations of the ligand uniformly at random in the parameter space (around the protein) • The energy E at each sampled conformation is computed: E = Einteraction + Einternal Einteraction = electrostatic + van der Waals potential Einternal = Snon-bonded pairs of atoms electrostatic + van der Waals • A sampled conformation is retained as a node of the roadmap with probability:0 if E > Emax Emax-E Emax-Emin 1 if E < Emin Denser distribution of nodes in low-energy regions of conformational space
qi qi+1 q q’ Emax Roadmap Construction (Edge Generation) • Each node connected to closest neighbors by straight edges • Each edge is discretized so that between qi and qi+1 no atom moves by more than some ε (= 1Å) • If any E(qi) > Emax , then the edge is rejected
qi qi+1 q q’ Heuristic measureof energetic difficultyof moving from q to q’ Roadmap Construction (Edge Generation) • Any two nodes closer than some threshold distance are connected by a straight edge • Each edge is discretized so that between qi and qi+1 no atom moves by more than some ε (= 1Å) • If for all qi, E(qi) Emax, the edge q to q’ is retained and is assigned two weights w(qq’) and w(q’q) where: (probability that the ligand moves from qi to qi+1 when it is constrained to move along the edge)
Querying the Roadmap • For a given goal node qg (e.g., binding conformation), compute lowest-weight paths from qg to each node (in either direction) in O(NlogN) time, where N = number of nodes • Various quantities can then be easily computed in O(N) time, e.g., average weights of all paths entering qg and of all paths leaving qg(~ binding and dissociation rates Kon and Koff) Protein: Lactate dehydrogenase Ligand: Oxamate (7 degrees of freedom)
Experiments on 3 Protein-ligand Complexes • PDB ID: 1ldm Receptor: Lactate Dehydrogenase (2386 atoms, 309 residues) Ligand: Oxamate (6 atoms, 7 dofs) • PDB ID: 4ts1 Receptor: Mutant of tyrosyl-transfer-RNA synthetase (2423 atoms, 319 residues) Ligand: L- leucyl-hydroxylamine (13 atoms, 9 dofs) • PDB ID: 1stp Receptor: Streptavidin (901 atoms, 121 residues) Ligand: Biotin (16 atoms, 11 dofs)
active site Computation of Potential Binding Conformations • Sample many (several 1000’s) ligandconformations at random around protein • Repeat several times: • Select lowest-energy conformations that are close to protein surface • Resample around them • Retain k (~10) lowest-energy conformations whose centers of mass are at least 5Å apart lactate dehydrogenase