Download
1 / 43
450 likes | 746 Views
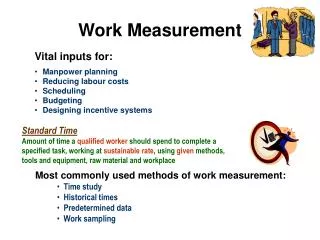
Methods and Work Measurement. Lecture 4: The General Problem Solving Process 6 March 2009. Systematic Procedures for “work measurement and ergonomy ”. Identify problem Collect data Analyze data Develop alternative solutions Select a solution Install solution Follow up.

E N D
Methods and Work Measurement Lecture 4: The General Problem Solving Process 6 March 2009
Systematic Procedures for “work measurement and ergonomy” • Identify problem • Collect data • Analyze data • Develop alternative solutions • Select a solution • Install solution • Follow up Hanna Lestari, ST, M.Eng-FTI-UII
Problem Identification Tools: -Pareto analysis - Fishbone diagram - Gantt chart - PERT charting Examples: • Product with low profit • Bottleneck operations • Workers complaints Hanna Lestari, ST, M.Eng-FTI-UII
Recording Tools • Operation Process Chart (OPC) • Flow Process Chart • Flow Diagram • Gang Process Charts • Worker and Machine Process Charts • The Two-hand Process Chart Hanna Lestari, ST, M.Eng-FTI-UII
Analysis Tools • 5 Why • Why is this operation necessary? • Why is this operation performed in this manner? • … • 4W + 1H • How can the operation be performed better? • Who can best perform the operation? • Where could … • When … • Why … Hanna Lestari, ST, M.Eng-FTI-UII
7 Tools • Check sheets • Histograms • Pareto diagrams • Cause and effect diagrams • Stratification • Scatter diagrams • SPC Hanna Lestari, ST, M.Eng-FTI-UII
7 Waste • Waste from overproduction • Waste from waiting times • Waste from transportation and handling • Waste related to useless and excess inventories • Waste in production process • Useless motions • Waste from scrap and defects Hanna Lestari, ST, M.Eng-FTI-UII
The General Problem-solving Process Function of Organization Decision Making Process 8 Steps of Problem Solving • Determining the priority • of problem • Problem • Identification Plan 2. Finding causes of problem 3. Investigate the most important/main causes 4. Determining the steps of improvement 2. Developing Alternatives Solution Do 3. Selecting Alternative 5. Do the steps 4. Implementation Check 5. Evaluation 6. Evaluating the result of improvement 7. Preventing the problem occur again Action 8. Solve the next problems Hanna Lestari, ST, M.Eng-FTI-UII
Problem-Solving Tool Kit Hanna Lestari, ST, M.Eng-FTI-UII
Problem-Solving Tools • Problem-Solving Tools is called by seven quality control tools. They are: • 1. Check sheet • 2. Histogram • 3. Pareto diagram • 4. Fish diagram (the cause-effect diagram) • 5. Stratification • 6. Scatter diagram • 7. Statistical Process Control (SPC) Hanna Lestari, ST, M.Eng-FTI-UII
Check Sheets • Check sheet is a simple tool for collecting data so that the errors that probably occurred can be avoided. Hanna Lestari, ST, M.Eng-FTI-UII
Checksheets Purpose: • Tool for collecting and organizing measured or counted data • Data collected can be used as input data for other quality tools Benefits: • Collect data in a systematic and organized manner • To determine source of problem • To facilitate classification of data (stratification) Hanna Lestari, ST, M.Eng-FTI-UII
Histogram • This tool is to function as describing a distribution type of data. Hanna Lestari, ST, M.Eng-FTI-UII
Histograms Purpose: To determine the spread or variation of a set of data points in a graphical form How is it done?: • Collect data, 50-100 data point • Determine the range of the data • Calculate the size of the class interval • Divide data points into classes Determine the class boundary • Count # of data points in each class • Draw the histogram Stable process, exhibiting bell shape Hanna Lestari, ST, M.Eng-FTI-UII
Pareto Diagram • Problem areas can be defined by a technique developed by the economist Vilfredo Pareto to explain the concentration of wealth. In Pareto analysis, items of interest are identified and measured on a common scale and are then ordered in ascending order, creating a cumulative distribution Hanna Lestari, ST, M.Eng-FTI-UII
Pareto Diagram Purpose: Prioritize problems. How is it done? • Create a preliminary list of problem classifications. • Tally the occurrences in each problem classification. • Arrange each classification in order from highest to lowest • Construct the bar chart Hanna Lestari, ST, M.Eng-FTI-UII
Pareto Diagram Benefits: • Pareto analysis helps graphically display results so the significant few problems emerge from the general background • It tells you what to work on first Hanna Lestari, ST, M.Eng-FTI-UII
Pareto Diagram Pareto Charts Weighted Pareto • Weighted Pareto charts use the quantity of defects multiplied by their cost to determine the order. Hanna Lestari, ST, M.Eng-FTI-UII
Fishbone Diagram • Also known as ishikawa or cause-effect diagram.Fish diagrams were developed by Ishikawa in the early 1950s • No statistics involved • Maps out a process/problem • Makes improvement easier • Looks like a “Fish Skeleton” Hanna Lestari, ST, M.Eng-FTI-UII
Fishbone Diagram Hanna Lestari, ST, M.Eng-FTI-UII
Constructing a Fishbone Diagram • Step 1 - Identify the Problem • Step 2 - Draw “spine” and “bones” Example: High Inventory Shrinkage at local Drug Stor Shrinkage Hanna Lestari, ST, M.Eng-FTI-UII
Constructing a Fishbone Diagram • Step 3 - Identify different areas where problems may arise from Ex. : High Inventory Shrinkage at local Drug Store employees Shrinkage shoplifters Hanna Lestari, ST, M.Eng-FTI-UII
Constructing a Fishbone Diagram • Step 4 - Identify what these specific causes could be Ex. : High Inventory Shrinkage at local Drug Store Shrinkage Anti-theft tags poorly designed Expensive merchandise out in the open No security/ surveillance shoplifters Hanna Lestari, ST, M.Eng-FTI-UII
Constructing a Fishbone Diagram • Ex. : High Inventory Shrinkage at local Drug Store employees attitude training new trainee practices benefits Shrinkage Anti-theft tags poorly designed Expensive merchandise out in the open No security/ surveillance shoplifters Hanna Lestari, ST, M.Eng-FTI-UII
Constructing a Fishbone Diagram • Step 5 – Use the finished diagram to brainstorm solutions to the main problems. Hanna Lestari, ST, M.Eng-FTI-UII
Stratification • Stratification is a effort for grouping data into several groups that have the similar characteristics • Use in combo with other tools • Separates data to view patterns • Use before collecting data • Improves estimation • Analyze subsets Hanna Lestari, ST, M.Eng-FTI-UII
Scatter Diagrams Purpose: To identify the correlations that might exist between a quality characteristic and a factor that might be driving it • A scatter diagram shows the correlation between two variables in a process. • These variables could be a Critical To Quality (CTQ) characteristic and a factor affecting it two factors affecting a CTQ or two related quality characteristics. • Dots representing data points are scattered on the diagram. • The extent to which the dots cluster together in a line across the diagram shows the strength with which the two factors are related. Hanna Lestari, ST, M.Eng-FTI-UII
Scatter Diagrams How is it done?: • Decide which paired factors you want to examine. Both factors must be measurable on some incremental linear scale. • Collect 30 to 100 paired data points. • Find the highest and lowest value for both variables. • Draw the vertical (y) and horizontal (x) axes of a graph. • Plot the data • Title the diagram The shape that the cluster of dots takes will tell you something about the relationship between the two variables that you tested. Hanna Lestari, ST, M.Eng-FTI-UII
If the variables are correlated, when one changes the other probably also changes. • Dots that look like they are trying to form a line are strongly correlated. • Sometimes the scatter plot may show little correlation when all the data are considered at once. • Stratifying the data, that is, breaking it into two or more groups based on some difference such as the equipment used, the time of day, some variation in materials or differences in the people involved, may show surprising results Scatter Diagrams Hanna Lestari, ST, M.Eng-FTI-UII
Scatter Diagrams • You may occasionally get scatter diagrams that look boomerang- or banana-shaped. • To analyze the strength of the correlation, divide the scatter plot into two sections. • Treat each halfseparately in your analysis • Benefits: • Helps identify and test probable causes. • By knowing which elements of your process are related and how they are related, you will know what to control or what to vary to affect a quality characteristic. Hanna Lestari, ST, M.Eng-FTI-UII
Statistical Process Control Hanna Lestari, ST, M.Eng-FTI-UII
Statistical Process Control Hanna Lestari, ST, M.Eng-FTI-UII
Statistical Process Control Hanna Lestari, ST, M.Eng-FTI-UII
Statistical Process Control Hanna Lestari, ST, M.Eng-FTI-UII
Statistical Process Control Hanna Lestari, ST, M.Eng-FTI-UII
Statistical Process Control Hanna Lestari, ST, M.Eng-FTI-UII
Statistical Process Control Hanna Lestari, ST, M.Eng-FTI-UII
Statistical Process Control Hanna Lestari, ST, M.Eng-FTI-UII
Statistical Process Control Hanna Lestari, ST, M.Eng-FTI-UII
The General Problem-solving Process • In fact, the five steps described here are useful in the logical and systematic approach to solving almost any problem. 1. Problem Definition. • The definition or formulation of the problem is the first step in the problem-solving procedure, this is often preceded by the need to recognize that a problem exists such as, • "Costs are too high," • "Output must be increased," or • "There is a bottleneck in order filling in the warehouse. "
The General Problem-solving Process(02) 2. Analysis of the Problem. • The formulation of the problem may have resulted in a broad statement or definition. Now it becomes necessary to obtain data to sort out the facts and determine how they apply to the problem 3. Search for Possible Solutions. • The basic objective of course is to find the preferred solution that will meet the criteria and the specifications that have been establish. This suggests that several alternative solutions be found and then the preferred solution can be selected from these.
The General Problem-solving Process(03) 4. Evaluation of Alternatives. • We have now arrived at several solutions or partial solutions to the problem under consideration. In fact, we may have accumulated a large number of ideas bearing on the problem. Some of these can be eliminated rather quickly and the remaining solutions can be considered more carefully. An examination can be made to determine to what extent each solution meets the criteria and conforms to the original specifications 5. Recommendation for Action. • In many cases, the person who solves the problem is not the one who will either use the recommended solution or give final approval for its adoption. Therefore, after the preferred solution has been found, it must be communicated to other persons. The most common form of communication of course is the written or oral report. The written report or the oral presentation then becomes the final step in the problem-solving procedure