Download
1 / 44
440 likes | 589 Views
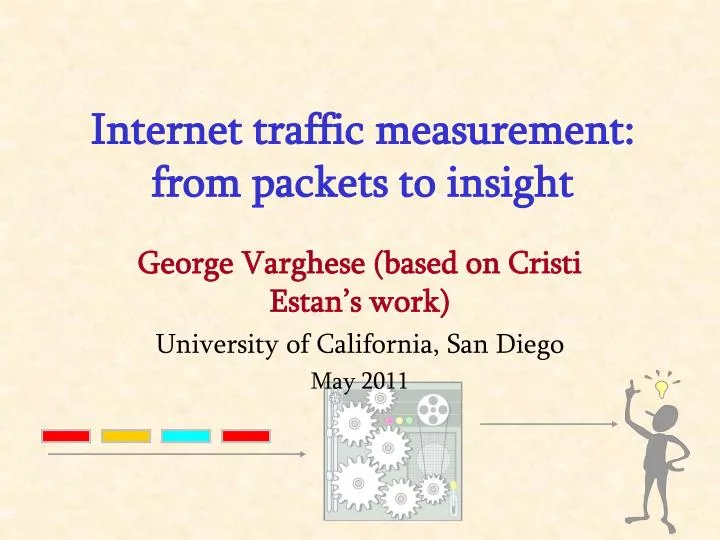
Internet traffic measurement: from packets to insight. George Varghese (based on Cristi Estan’s work) University of California, San Diego May 2011. Research motivation. The Internet in 1969. The Internet today. Flexibility, speed, scalability. Overloads, attacks, failures. Problems.

E N D
Internet traffic measurement:from packets to insight George Varghese (based on Cristi Estan’s work) University of California, San Diego May 2011
Research motivation The Internet in 1969 The Internet today Flexibility, speed, scalability Overloads, attacks, failures Problems Ad-hoc solutions suffice Measurement & control Engineered solutions needed Research direction: towards a theoretical foundation for systems doing engineered measurement of the Internet
Memory Current solutions Network Network Operator Router Analysis Server Accurate? Concise? Traffic reports Raw data Fast link State of the art: simple counters (SNMP), time series plots of traffic (MRTG), sampled packet headers (NetFlow), top k reports
Measurement challenges • Data reduction – performance constraints • Memory (Terabytes of data each hour) • Link speeds (40 Gbps links) • Processing (8 ns to process a packet) • Data analysis – unpredictability • Unconstrained service model (e.g. Napster, Kazaa ) • Unscrupulous agents (e.g. Slammer worm) • Uncontrolled growth (e.g. user growth)
Main contributions • Data reduction: Algorithmic solutions for measurement building blocks • Identifying heavy hitters (part 1 of talk) • Counting flows or distinct addresses • Data analysis: Traffic cluster analysis automatically finds the dominant modes of network usage (part 2 of talk) • AutoFocus traffic analysis system used by hundreds of network administrators
Identifying heavy hitters Network Network Operator Traffic reports Analysis Server Router Raw data Memory Fast link Identifying heavy hitters with multistage filters
Why are heavy hitters important? • Network monitoring: Current tools report top applications, top senders/receivers of traffic • Security: Malicious activities such as worms and flooding DoS attacks generate much traffic • Capacity planning: Largest elements of traffic matrix determine network growth trends • Accounting: Usage based billing most important for most active customers
Problem definition • Identify and measure all streams whose traffic exceeds threshold (0.1% of link capacity) over certain time interval (1 minute) • Streams defined by fields (e.g. destination IP) • Single pass over packets • Small worst case per packet processing • Small memory usage • Few false positives / false negatives
Measuring the heavy hitters • Unscalable solution: keep hash table with a counter for each stream and report largest entries • Inaccurate solution: count only sampled packets and compensate in analysis • Ideal solution: count all packets but only for the heavy hitters • Our solution: identify heavy hitters on the fly • Fundamental advantage over sampling – instead of (M is available memory)
uncertainty uncertainty uncertainty uncertainty Why is sample & hold better? Sample and hold Ordinary sampling
How do multistage filters work? Array of counters Hash(Pink)
How do multistage filters work? Collisions are OK
How do multistage filters work? Reached threshold Stream memory stream1 1 stream2 1 Insert
Stage 2 How do multistage filters work? Stream memory Stage 1 stream1 1
Conservative update Gray = all prior packets
Redundant Redundant Conservative update
Multistage filter analysis • Question: Find probability that a small stream (0.1% of traffic) passes filter with d = 4 stages * b = 1,000 counters, threshold T = 1% • Analysis: (any stream distribution & packet order) • can pass a stage if other streams in its bucket ≥ 0.9% of traffic • at most 111 such buckets in a stage => probability of passing one stage ≤ 11.1% • probability of passing all 4 stages ≤ 0.1114 = 0.015% • result tight
Multistage filter analysis results • d – filter stages • T – threshold • h=C/T, (C capacity) • k=b/h, (b buckets) • n – number of streams • M – total memory
Bounds versus actual filtering 1 Average probability of passing filter for small streams (log scale) Worst case bound Zipf bound Actual 0.1 0.01 0.001 0.0001 Conservative update 0.00001 1 2 3 4 Number of stages
Comparing to current solution • Trace: 2.6 Gbps link, 43,000 streams in 5 seconds • Multistage filters: 1 Mbit of SRAM (4096 entries) • Sampling: p=1/16, unlimited DRAM
? Summary for heavy hitters • Heavy hitters important for measurement processes • More accurate results than random sampling: . instead of • Multistage filters with conservative update outperform theoretical bounds • Prototype implemented at 10 Gbps
Accurate for 16-32 streams 8-15 streams 0-7 streams Building block 2, counting streams • Core idea • Hash streams to bitmap and count bits set • Sample bitmap to save memory and scale • Multiple scaling factors to cover wide ranges • Result • Can count up to 100 million streams with an average error of 1% using 2 Kbytes of memory
Bitmap counting Hash based on flow identifier Estimate based on the number of bits set Does not work if there are too many flows
Bitmap counting Increase bitmap size Bitmap takes too much memory
Bitmap counting Store only a sample of the bitmap and extrapolate Too inaccurate if there are few flows
Bitmap counting Accurate if number of flows is 16-32 8-15 0-7 Use multiple bitmaps, each accurate over a different range Must update multiple bitmaps for each packet
Bitmap counting 16-32 8-15 0-7
Bitmap counting 0-32 Multiresolution bitmap
Traffic cluster analysis Network Network Operator Traffic reports Analysis Server Router Raw data Memory Fast link Part 2: Describing traffic with traffic cluster analysis Part 1: Identifying heavy hitters, counting streams
Finding heavy hitters not enough • Aggregating on individual fields useful but • Traffic reports often not at right granularity • Cannot show aggregates over multiple fields • Traffic analysis tool should automatically find aggregates over right fields at right granularity What apps are used? Where does the traffic come from? …… Which network uses web and which one kazaa? Most traffic goes to the dorms …
Ideal traffic report Web is the dominant application This is a Denial ofService attack !! The library is a heavy user of web That’s a big flash crowd! Traffic cluster reports try to give insights into the structure of the traffic mix
Definition • A traffic report gives the size of all traffic clusters above a threshold T and is: • Multidimensional: clusters defined by ranges from natural hierarchy for each field • Compressed: omits clusterswhose traffic is within error T of more specific clusters in the report • Prioritized: clusters have unexpectedness labels
500 500 10.0.0.0/28 CS Dept 10.0.0.0/29 10.0.0.8/29 120 120 380 380 10.0.0.0/30 10.0.0.4/30 2nd floor 10.0.0.8/30 10.0.0.12/30 50 70 305 305 75 10.0.0.10/31 10.0.0.2/31 10.0.0.4/31 AI Lab 10.0.0.8/31 10.0.0.14/31 50 70 270 270 35 75 160 110 Unidimensional report example Hierarchy Threshold=100 40 35 15 35 30 160 110 75 10.0.0.2 10.0.0.3 10.0.0.4 10.0.0.5 10.0.0.8 10.0.0.9 10.0.0.10 10.0.0.14
500 10.0.0.0/28 120 380 305 10.0.0.8/30 270 10.0.0.8/31 160 110 Unidimensional report example Compression 380-270≥100 120 380 10.0.0.0/29 10.0.0.8/29 305-270<100 Rule: omit clusters with traffic within error T of more specific clusters in the report 160 110 10.0.0.8 10.0.0.9
Source net Application All traffic All traffic All traffic US EU EU Mail Web Mail RU CA NY FR RU RU Mail RU Web Multidimensional structure
names categories AutoFocus: system structure Cluster miner Web based GUI Grapher Traffic parser Packet header trace / NetFlow data
Traffic reports for weeks, days, three hour intervals and half hour intervals
Colors – user defined traffic categories Separate reports for each category
Analysis of unusual events • Sapphire/SQL Slammer worm • Found worm port and protocol automatically
Analysis of unusual events • Sapphire/SQL Slammer worm • Identified infected hosts
Related work • Databases [FS+98] Iceberg Queries • Limited analysis, no conservative update • Theory [GM98,CCF02] Synopses, sketches • Less accurate than multistage filters • Data Mining [AIS93] Association rules • No/limited hierarchy, no compression • Databases [GCB+97] Data cube • No automatic generation of “interesting” clusters