Download
1 / 25
250 likes | 454 Views
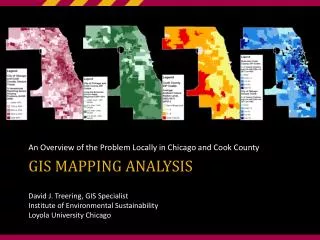
An Overview of the Problem Locally in Chicago and Cook County. GIS Mapping Analysis. David J. Treering, GIS Specialist Institute of Environmental Sustainability Loyola University Chicago. Purpose of Mapping What we hope to learn. Tools Used GIS - Geographic Information Systems.

E N D
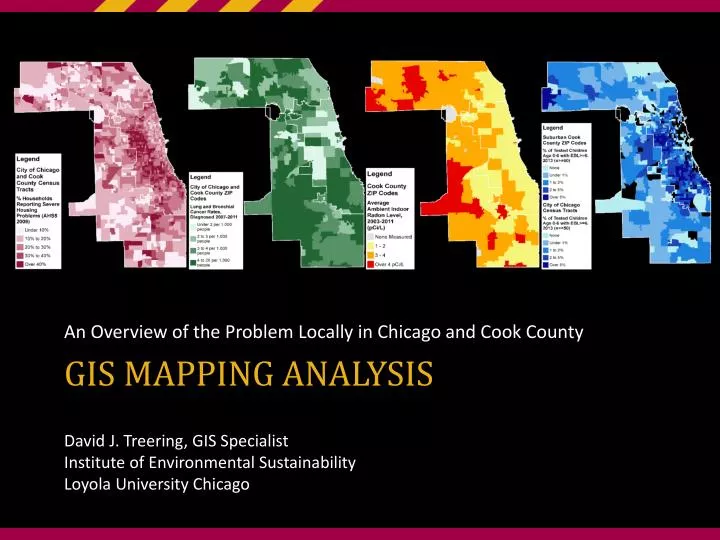
An Overview of the Problem Locally in Chicago and Cook County GIS Mapping Analysis David J. Treering, GIS Specialist Institute of Environmental Sustainability Loyola University Chicago
Purpose of MappingWhat we hope to learn Tools Used GIS - Geographic Information Systems • A computer system designed to capture, store, manipulate, analyze, manage, and present all types of geographical data Define particular areas within the larger region for targeted action to address particular concerns around Healthy Homes Where problems exist and where they have been remedied Where and for what hazards/outcomes data is lacking
Translating the Problem Map where environmental toxins are found in homes by community Collect Chicago and Cook County data Establish Priorities Establish Research Agenda
Scope: Chicago and Cook County • Units of Geography • Tracts (1,318) • ZIP Codes (191) • Municipalities (173)
Approach and Dataset Collection • Data brainstorming with partners to develop a wish list for collection • Socioeconomic and Demographic data • Physical Building and Environmental Quality data • Public Health Outcome and Intervention data • Visualizing the spatial relationships helps identify areas of greatest need
Socioeconomic & Demographic Factors: Age % of Population Under Age 5 % of Population Over Age 65 Tracts Tracts
Socioeconomic & Demographic Factors: Housing % Households with Foreclosure Filed Renter Fraction of Households Tracts Tracts
Socioeconomic & Demographic Factors: Health % of Population with a Disability % of Population with Health Insurance Tracts Tracts
Median Age of Multi Family Residential Buildings • Cook County Assessor data by Parcel • Summarized the Age of Buildings in each Census Tract. • Median Age shows the central value within each Tract • Very old multi family units are pervasive Median Age By Tract Tracts
Median Age of Single Family Residential Buildings • Cook County Assessor data by Parcel • Summarized the Age of Buildings in each Census Tract. • Median Age shows the central value within each Tract • Very old single family units are pervasive throughout Cook County Median Age By Tract Tracts
Code Violations for Peeling Paint • Building Code Violations for Flaky or Peeling Interior Paint in Residential Buildings, 2008-2013 • City of Chicago 311 Complaints for Peeling or Flaky Paint, 2006-2013 Points Tracts Tracts
Code Violations & 311 Complaints for Rodents • Chicago Building Code Violations for Rats, Mice or Rodents in Residential Buildings, 2008-2013 • City of Chicago 311 Request/Complaints for Rat Baiting, 2006-2013 Points Tracts Tracts
Code Violations for Presence of Roaches or Insects , 2006-13 • Building Code Violations, 2006-2013 for Presence of Roaches or other Insects in Residential Buildings • Summarized as a Count per Census Tract Points Tracts
Code Violations for Missing Carbon Monoxide Detector, 2006-13 • Building Code Violations, 2006-2013 for Missing Carbon Monoxide Detector in Residential Buildings • Summarized as a Count per Census Tract Points Tracts
Radon Gas Measurements % with Dangerous Level Average Level ZIP Codes ZIP Codes
Repairs and Renovations • Metropolitan Tenants Organization MTO Hotline Complaints regarding Necessary Repairs, 2006-2013 • Building Permits for Repairs and Renovations, 2002-2013 Tracts Tracts
Severe Housing Problems • Percentage of households reporting 1-4 of the following problems • Overcrowding • High Cost Burden • Lack of Plumbing or Kitchen facilities • Source: American Housing Survey, 2005-2009 Tracts
Public Health: Lead Poisoning, 2013 # BLL Tests EBL > 5 Prevalence Tracts & ZIP Codes • Chicago DPH, Cook County DPH & Illinois DPH childhood Lead Poisoning Testing and Prevalence in 2013 (n >=50) Tracts & ZIP Codes
Public Health: Asthma Attacks • Chicago Fire Department ambulance runs where albuterol was administered during an asthma attack in 2013 • City of Chicago total = 8,692 • Contains multiple instances of the same patient Tracts
Public Health: Lung Cancer • Illinois Department of Public Health, Illinois State Cancer Registry, Public Data Set • Cancers of the Lung and Bronchus by ZIP Code, • Diagnosed from 2007-2011 ZIP Codes
Public Health: Fire and CO Injuries • Chicago Fire Department reported injuries from Carbon Monoxide Poisoning and Fires by Census Tract in 2013 Tracts
Next Steps: Identifying Areas of Greatest Concern • Targeting areas of overlap • High incidence of public health concerns • High incidence of physical environment concerns • Defining the affected populations • Poor, Young, Uninsured, Disabled For Example, High Building Code Violations for Rats and Mice coincides with Greater Asthma Prevalence
Where More Data are Needed • Additional Physical Environment data • Suburban Cook County municipal data • Building Code Violations and Complaints • Repairs and Renovations • Additional Public Health data • Asthma surveillance data • Poison Control Center data • Suburban Cook County municipal data • EMS/Fire Department data • Current and Historical Remediations & Intervention Programs • Ideally, an Integrated Health and Housing Database
AcknowledgementsSpecial Thanks To: Nancy Tuchman, Director, Institute of Environmental Sustainability (IES) Anita Weinberg, Director, ChildLaw Policy Institute, Civitas ChildLaw Center Katherine Kaufka-Walts, Director, Center for the Human Rights of Children Phil Nyden, Director, Center for Urban Research and Learning (CURL) David Van Zytveld, Asst. Director, CURL Travis O’Rear, GIS Consultant Teresa Neumann, Research Associate, CURL Dave Jacobs, National Center for Healthy Housing Emile Jorgensen, Epidemiologist, CDPH Deanna Durica, Director, Lead Poisoning Prevention & Healthy Homes Unit, CCDPH Buddy Bates, Epidemiologist, CCDPH John Bartlett, Executive Director, Metropolitan Tenants Organization Chanell Marshall, Green Healthy Homes Initiative All the other Partners who contributed data and expertise! Staff of Loyola Centers that made today happen!
Access to Maps During Summit • PDF online: http://www.luc.edu/healthyhomes/maps • Getting online • netreg2.luc.edu to register as a Loyola Guest • Username: healthyhomes • Password: luc511942