Download
1 / 35
350 likes | 463 Views
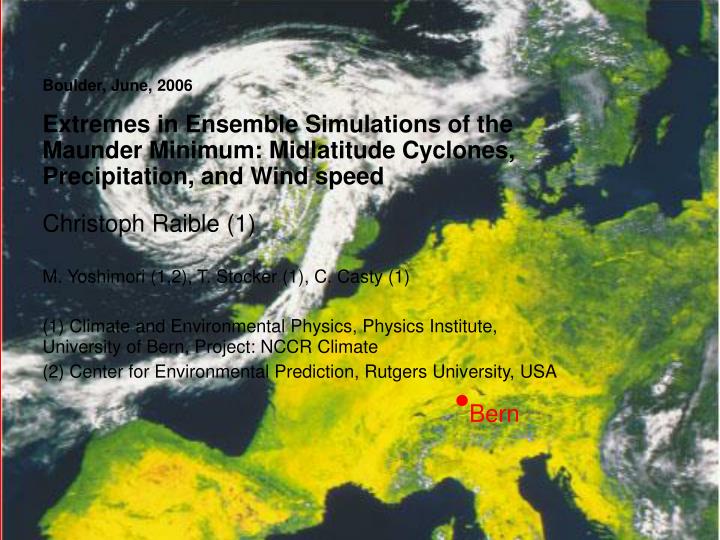
Boulder, June, 2006 Extremes in Ensemble Simulations of the Maunder Minimum: Midlatitude Cyclones, Precipitation, and Wind speed. Christoph Raible (1) M. Yoshimori (1,2), T. Stocker (1), C. Casty (1)

E N D
Boulder, June, 2006Extremes in Ensemble Simulations of the Maunder Minimum: Midlatitude Cyclones, Precipitation, and Wind speed Christoph Raible (1) M. Yoshimori (1,2), T. Stocker (1), C. Casty (1) (1) Climate and Environmental Physics, Physics Institute, University of Bern, Project: NCCR Climate (2) Center for Environmental Prediction, Rutgers University, USA Bern
A European Pattern Climatology from 1766-2000 Motivation Coast line of northern Germany • Hamburg
Model and experimental design Mean changes in the Maunder Minimum Extremes in cyclone intensity Summary Outlook A European Pattern Climatology from 1766-2000 Outline
Community Climate System Model (version 2 from NCAR) Atmosphere: T31(3.75ºx3.75º), 26 vertical levels Ocean: 3.6ºx1.8º, 25 vertical levels Land Sea ice Coupled without flux corrections A European Pattern Climatology from 1766-2000 Model
Simulations: 1990 control forced with perpetual 1990 AD conditions: 300 yrs (used: last 152yrs) 1640 control forced with perpetual 1640 AD conditions: 350 yrs 6 transient ensemble simulations for the Maunder Minimum (TMM) from 1640 -1715 AD A European Pattern Climatology from 1766-2000 Experimental design
Simulations: 1990 control forced with perpetual 1990 AD conditions: 300 yrs (used: last 152yrs) 1640 control forced with perpetual 1640 AD conditions: 350 yrs 6 transient ensemble simulations for the Maunder Minimum (TMM) from 1640 -1715 AD A European Pattern Climatology from 1766-2000 Experimental design
A European Pattern Climatology from 1766-2000 Mean changes: cyclone density (DJF) 1990 CTRL Difference: mean of TMM – 1990 CTRL significant at the 5% level Unit: number / (1000km)2
A European Pattern Climatology from 1766-2000 Mean changes in extremes (DJF) Difference TMM – 1990 CTRL of the 90% percentile of Precipitation wind speed Unit: mm/day Unit: m/s significant at the 5% level
A European Pattern Climatology from 1766-2000 Definition of regions Atlantic Pacific Europe Northern Europe Southern Europe
A European Pattern Climatology from 1766-2000 Definition of cyclone intensity Cyclone intensity index Cyclone track: Estimation of Z1000 gradient within 1000km around the minimum for each time step Distribution of intensity index
A European Pattern Climatology from 1766-2000 Extremes in cyclone intensity Distribution of the intensity of strong cyclones in the North Atlantic (DJF): • Ensemble of Maunder Minimum Simulations (TMM) • 1990 Control simulation (CTRL)
A European Pattern Climatology from 1766-2000 Mean changes in extreme cyclone intensity Difference in the mean of the distribution of cyclone intensity (TMM – 1990 Ctrl) Significant values (95% level) are highlighted in bold. If all ensemble members have greater values than the control, the means are underlined.
A European Pattern Climatology from 1766-2000 Summary • A southward shift of the tail-end of the mid-latitude cyclone tracks in the Maunder Minimum (MM) which is related to extremes in precipitation and wind speed in winter • Extremes in cyclone intensity are stronger in the MM compared with today, even though the number of cyclones is decreased in some areas (e.g., northern Europe).
A European Pattern Climatology from 1766-2000 Reason for intensification of Maunder Minimum cyclones • Increased meridional temperature gradient. • Increased lower tropospheric baroclinicity, which is not balanced by the upper tropospheric baroclinicity. • The diabatic component of cyclones seems to play a minor role in intensification of MM cyclones
A European Pattern Climatology from 1766-2000 Outlook • Comparison with proxy reconstructions • Analysis of extremes with respect to blocking and cold spell events in the Maunder Minimum • Applying the analysis of extreme to transient simulations with CCSM3 from 1500 to 2100 AD
Worse than extreme cyclones … extreme ironing! A European Pattern Climatology from 1766-2000
A European Pattern Climatology from 1766-2000 Mean changes Solar and volcanic forcing: Low-pass filtered Northern Hemisphere temperature anomaly in relation to perpetual 1640 AD simulation:
A European Pattern Climatology from 1766-2000 Conclusions • There is a connection between cyclone intensity and precipitation and wind speed extremes in winter. • The cyclone intensity is also connected with the large-scale atmospheric circulation. • In summer the relationships vanish. • Both connections are independent from the climate state (no changes comparing TMM with 1990 Ctrl).
A European Pattern Climatology from 1766-2000 Mean changes: 2m temperature (DJF) 1990 CTRL Difference: mean of TMM – 1990 CTRL significant at the 5% level Unit: Celsius
A European Pattern Climatology from 1766-2000 Mean changes: Z1000 (DJF) 1990 CTRL Difference: mean of TMM – 1990 CTRL significant at the 5% level Unit: gpm
A European Pattern Climatology from 1766-2000 Mean changes: Eady growth rate (DJF) in 700 hPa 1990 CTRL Difference: mean of TMM – 1990 CTRL significant at the 5% level Unit: 1/day
A European Pattern Climatology from 1766-2000 Mean changes: Eady growth rate (DJF) in 300 hPa 1990 CTRL Difference: mean of TMM – 1990 CTRL significant at the 5% level Unit: 1/day
A European Pattern Climatology from 1766-2000 Conclusions Latent heat flux change TMM – CTRL in W/m2 for winter
A European Pattern Climatology from 1766-2000 Changes in extreme precipitation (90% percentile Difference: mean of TMM – 1990 CTRL JJA DJF Shading: 95% significant Unit: mm/day
A European Pattern Climatology from 1766-2000 Changes in extreme precipitation (90% percentile Difference: mean of TMM – 1990 CTRL JJA DJF Shading: 95% significant Unit: m/s
Simulations: 1990 control forced with perpetual 1990 AD conditions: 300 yrs (used: last 152yrs) 1640 control forced with perpetual 1640 AD conditions: 350 yrs 6 transient ensemble simulations for the Maunder Minimum (TMM) from 1640 -1715 AD A European Pattern Climatology from 1766-2000 Experimental design
A European Pattern Climatology from 1766-2000 Mean changes: precipitation (DJF) 1990 CTRL Difference: mean of TMM – 1990 CTRL c Shading: 95% significant Unit: mm/day
A European Pattern Climatology from 1766-2000 Mean changes: wind speed (DJF) in 1000 hPa 1990 CTRL Difference: mean of TMM – 1990 CTRL Shading: 95% significant Unit: m/s
Have extremes in cyclone characteristics changed under colder climate conditions than today? Are extremes in cyclone characteristics linked to extremes in precipitation and wind speed? What is the relation between extremes in cyclones and the general atmospheric circulation? A European Pattern Climatology from 1766-2000 Motivation
Have extremes in cyclone characteristics changed under colder climate conditions than today? Are extremes in cyclone characteristics linked to extremes in precipitation and wind speed? What is the relation between extremes in cyclones and the general atmospheric circulation? Note that half-daily data is used for the following analysis. A European Pattern Climatology from 1766-2000
Have extremes in cyclone characteristics changed under colder climate conditions than today? Are extremes in cyclone characteristics linked to extremes in precipitation and wind speed? What is the relation between extremes in cyclones and the general atmospheric circulation? A European Pattern Climatology from 1766-2000
A European Pattern Climatology from 1766-2000 Correlation: Cyclone intensity and extremes in precipitation / wind speed (DJF) N-Europe Atlantic S-Europe Precip.: c Wind speed:
A European Pattern Climatology from 1766-2000 Correlation: Cyclone intensity and extremes in precipitation / wind speed (JJA) N-Europe Atlantic S-Europe Precip.: Wind speed:
A European Pattern Climatology from 1766-2000 Correlation: Cyclone intensity index and Z1000 / 2m temperature (DJF) N-Europe Atlantic S-Europe Z1000: 2m Temp.:
A European Pattern Climatology from 1766-2000 Correlation: Cyclone intensity index and Z1000 / 2m temperature (JJA) N-Europe Atlantic S-Europe Z1000: 2m Temp.: