1 / 1

Single Coverage

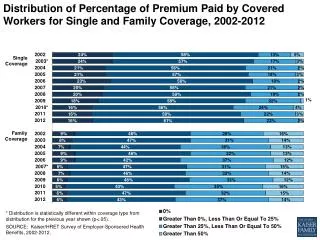
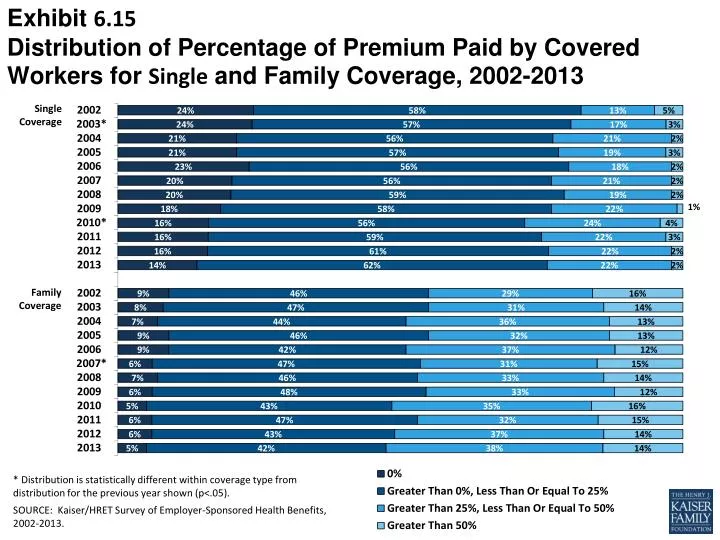
Exhibit 6.15 Distribution of Percentage of Premium Paid by Covered Workers for Single and Family Coverage, 2002-2013. Single Coverage. Family Coverage. * Distribution is statistically different within coverage type from distribution for the previous year shown (p<.05 ).

betha
Download Presentation

Single Coverage

An Image/Link below is provided (as is) to download presentation Download Policy: Content on the Website is provided to you AS IS for your information and personal use and may not be sold / licensed / shared on other websites without getting consent from its author. Content is provided to you AS IS for your information and personal use only. Download presentation by click this link. While downloading, if for some reason you are not able to download a presentation, the publisher may have deleted the file from their server. During download, if you can't get a presentation, the file might be deleted by the publisher.

E N D

Presentation Transcript


  1. Exhibit 6.15Distribution of Percentage of Premium Paid by Covered Workers for Single and Family Coverage, 2002-2013 Single Coverage Family Coverage * Distribution is statistically different within coverage type from distribution for the previous year shown (p<.05). SOURCE: Kaiser/HRET Survey of Employer-Sponsored Health Benefits, 2002-2013.

More Related