Download
1 / 10
100 likes | 332 Views
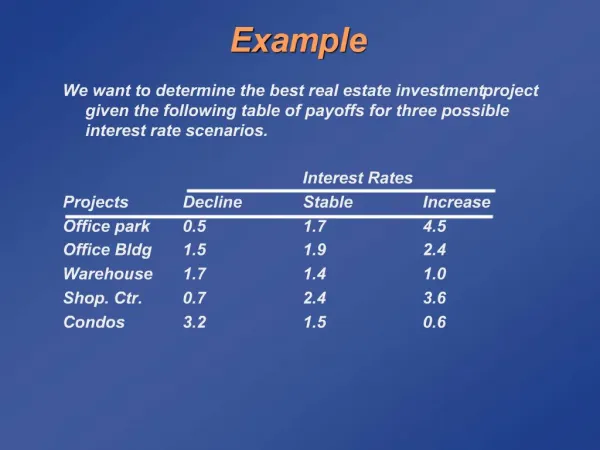
Example 16.8. Forecasting Quarterly Soft Drink Sales. Soft Drink Sales.xlsx. The data in this file represent quarterly sales (in millions of dollars) for a large soft drink company from quarter 1 of 1990 through quarter 1 of 2005.

E N D
Example 16.8 Forecasting Quarterly Soft Drink Sales
Soft Drink Sales.xlsx The data in thisfile represent quarterly sales (in millions of dollars) for a large soft drink company from quarter 1 of 1990 through quarter 1 of 2005. As we might expect, there has been an upward trend in sales during this period, and there is also a fairly regular seasonal pattern, as shown on the next slide. Sales in the warmer quarters, 2 and 3, are consistently higher than in the colder quarters, 1 and 4. How well can Winters’ method track this upward trend and seasonal pattern?
Solultion The procedure required for Winters’method is practically the same as for Holt’s method. We again create a data set with StatTools, and then we fill in the dialog box for forecast settings as shown on the next slide. The only difference is that when we check theWinters’ option, an extra smoothing constant (for seasonality) appears.
Discussion of the Results The StatTools output for Winters’ method is very similar to the Holt’s method output. The summary section on the next slide shows the optimal smoothing constants, which produce a MAPE of 4.41%. Again, you can manually try other smoothing constants in the range B9:B11 to see how sensitive the summary measures are to the smoothing constants.
Discussion of the Results -- continued The detailed data section shown on the next slide implements the exponential smoothing equations for Winters’ method.
Discussion of the Results -- continued The chart on the next slide indicates how well Winters’ method (with these smoothing constants) tracks the sales pattern through time. It even picks up the slight decrease in the upward trend in more recent years and projects this pattern into the future. If we had used Holt’s method on this data set, it would have identified the upward trend, but it would have completely missed the seasonal pattern.